Myths of "VMT-Mitigation"

Many Cultures have Myths of Fantastical Creatures
One such is "VMT-Mitigation"
Introduction
California has mandated in SB-743 that cities use "Vehicle Miles Traveled" (VMT) instead of "Level of Service" (LOS) to measure environmental impacts of new development projects. The idea is that if cities plan for higher density, people will drive less and there will be fewer pollutants and greenhouse gasses (GHG) emitted.


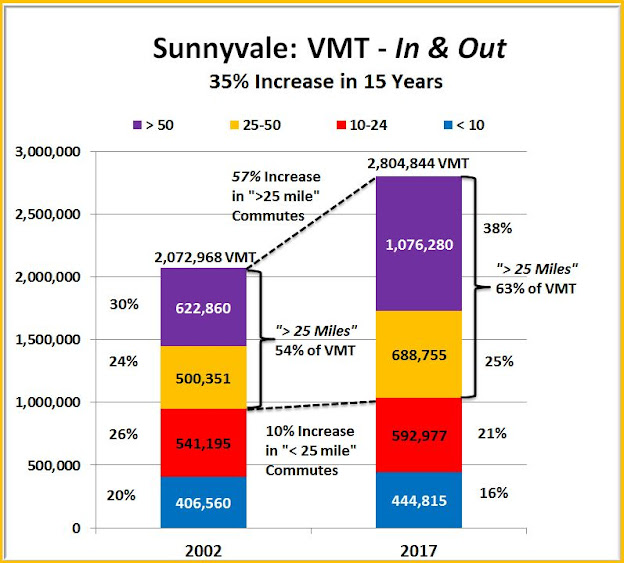


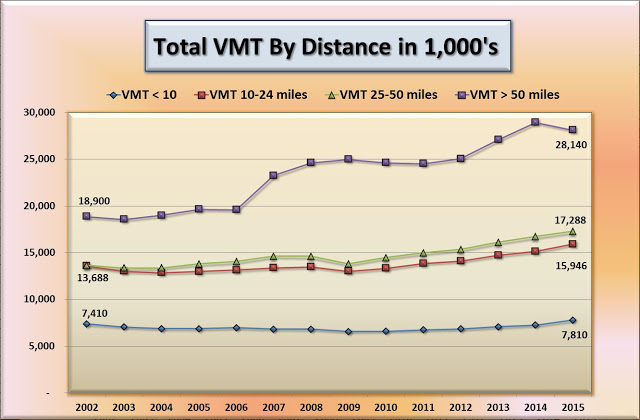
Sounds nice. It isn't working. See graph below of US Census data for those commuting in and those commuting out. An overall 35% increase in VMT from 2002 - 2015. Most of the increase comes from those driving more than 25 miles.
The following chart shows census data for commutes calculated to produce VMT numbers for one-way commutes of
- Greater than 50 miles (purple)
- Between 25 and 50 miles (yellow)
- Between 10 and 24 miles (red)
- Less than 10 miles (blue)

What is more, this increase in higher mileage commuters is due to a relatively small proportion of the commuters. Only 22% of the commuters are responsible for 63% of the VMT.
Note that 55% of the commuters, those that commute less than 10 miles, are responsible for only 16% of the VMT. That means that a 10% reduction in "under 10 mile" VMT would only reduce VMT by 1.6% of Sunnyvale's total - a trivial amount. This implies that all efforts to get people to bike to work, or take public transit are not going to make much difference, even if they succeed.

It's getting worse, in case you hadn't noticed.
Data Analysis
Using the US Census tool, "OnTheMap" (https://onthemap.ces.census.gov) we get data summarized in the next four charts.
Census classifies commuting into four ranges: under 10 miles ("< 10"), from 10 to 24 miles ("10-24"), from 25 to 50 miles ("25-50"), and greater than 50 miles ("> 50".
For those commuting IN to Sunnyvale, VMT increased 29% over the 15 years studied. It increased in all four classifications, but it increased 46%, in the ("25-50" + "> 50") mile commutes growing from 56% of VMT to 64% of VMT.

Data derived later in text below.
For those commuting OUT of Sunnyvale, VMT increased 35% over the 15 years studied. It increased in all four classifications, but it increased 46%, in the ("25-50" + "> 50") mile commutes growing from 54% of VMT to 63% of VMT.
The hypothesis "build more housing near work centers to lessen VMT" is thus shown to be counterfactual.
After leveling off during the "Great Recession", VMT has resumed its upward trend. It is becoming clear that very soon, electric vehicles will solve the GHG emissions issue. However, the proposals in SB-743 include reduced parking because everyone will walk-bike-bus to work, and Sacramento policy makers apparently want to make freeway traffic worse. This will not turn out well.
Vehicle Miles Traveled
1970 - 2020 Annualized

From:
Another, more subtle, point is that if decision-makers actually think this VMT reduction idea works in reducing GHG emissions, they will be less inclined to support more significant measures that actually do work, such as requiring all new office construction to have "net-zero" GHG emissions.
Link to this post: http://meetingthetwain.blogspot.com/2020/06/vmt-and-ghg-emissions.html
We use the US Census tool "On the Map". Instructions for the tool here:
--------------------------------------
Sunnyvale Commute In/Out Data
US Census data for the 15 years from 2002 to 2017 shows that:
- The number of workers living in Sunnyvale increased by just over 12,000,
- The number commuting out of Sunnyvale for work increased by nearly 13,000,
- The number of workers in Sunnyvale increased by just over 10,000,
- The number of those both living and working in Sunnyvale decreased by 469,
This is seen in the two images from "On The Map" below (click on images to enlarge)
Sunnyvale Work & Commute
2002 & 2017

2002
Employed in Sunnyvale = 78,329
Reside in Sunnyvale = 58,772
Commute Out = 49,164
Commute In = 68,771

2017
Employed in Sunnyvale = 88,572 = 10,243 increase from 2002
Workers Resident in Sunnyvale = 71,175 = 12,403 increase from 2002
Commuting Out = 62,086 = 12,922 increase from 2002
Commuting In = 79,483 = 10,772 increase from 2002
Above data shown in bar chart below (click on image to enlarge):
Sunnyvale Totals:
Resident Workers, non-Resident workers and Commuters.
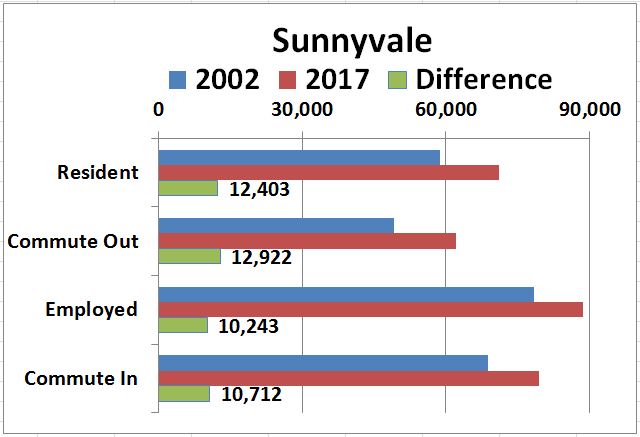
Green bars show the increase in each category.
Increase in outbound commuters exceeds increase in residents
Increase in inbound commuters exceeds increase in workers
Clearly, the data shows that despite increased housing in Sunnyvale there is more outbound commuting. Similarly, despite increased job numbers, there is more inbound commuting. US Census data thus shows that increasing the opportunity to live and work in Sunnyvale is completely ineffective in lessening commuting either in or out.
--------------------------------------
Sunnyvale VMT Data
Outward Bound:
We look first at those commuting from Sunnyvale to other towns to work. More important than how many commute in or out is how far they travel. If people are simply commuting a mile or two between neighboring towns it doesn't matter how many are doing so. Fortunately, "On The Map" also shows how far people commute and how that has changed over 15 years as seen below (click graphic to enlarge).
Commute distance - outward bound commuters
2002 (left) & 2017 (right)

The increases are key. The number commuting 25-50 and over 50 miles increased more than those commuting less than 10 miles. This is summarized in the chart below (click image to enlarge):
Sunnyvale - Outward Commuting
Number of Commuters vs Miles Traveled
2002-2017

One thing to note above is that the increase of 6,827 commuting out of Sunnyvale more than 10 miles was greater than the increase of 5,626 commuting less than 10 miles.
In other words, a "reverse sprawl" is happening - there is a significant increase in those commuting out of the job centers of Silicon Valley. This has a dramatic effect on VMT because one person commuting 50 miles produces the same VMT as 5 people commuting 10 miles.
We can see this when we calculate the VMT for commuters from Sunnyvale. We approximate the VMT corresponding to the above data by taking the mid-point of each mileage range (assume 60 miles for ">50") and multiply the total number of commuters in each range by that mid-point.
For example, to calculate the total VMT for all those commuting less than 10 miles, "< 10", we multiply the average of the mileage range, [5 miles = (10-0)/2], times the total number of people commuting that range in 2002, (42,435). I.e., the 2002 VMT for those commuting less than 10 miles was:
5 miles x 42,435 commuters = 212,175 VMT.
Doing this for all the data for commuters leaving Sunnyvale for work elsewhere is shown in the table below:
VMT for those Commuting OUT of Sunnyvale

The above data is graphed below (click on image to enlarge):

As an example of the above data in context, we see that in 2017, the 18% of commuters who traveled out of Sunnyvale more than 25 miles contributed 62% of the total of over one million VMT. This is summarized in the chart below:

The summary chart above shows there has been a significant increase in VMT for those leaving Sunnyvale to work in other cities. Note that most of the increase has been in the greater than 25 miles "> 25" commute class comprised of the "25-50 miles" and "greater than 50 miles" Census classifications. Those two classes have gone from 50% of VMT to 62%.
The "under 10 mile" commute class in now only 23% of the total VMT. But this "< 10 mile" commute is where all the effort has gone in trying to get people onto buses and biking to work. It is wasted effort as they aren't contributing most of the VMT.
We see that the hypothesis that "adding more housing reduces VMT and therefore GHG emissions" is counterfactual for outward bound commuting.
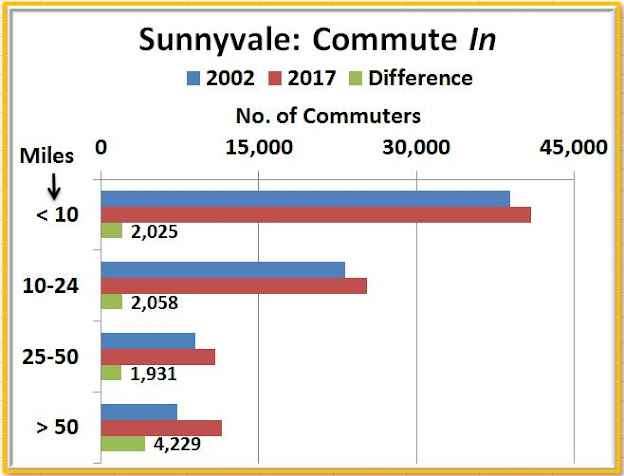
Inward Bound:
We do the same thing for those commuting into Sunnyvale. Same drill, different data. See below - click on images to enlarge:
Commute distance - Inward Bound Commuters
2002 (left) & 2017 (right)

Sunnyvale - Inbound Commuting
Number of Commuters vs Miles Traveled
2002-2017
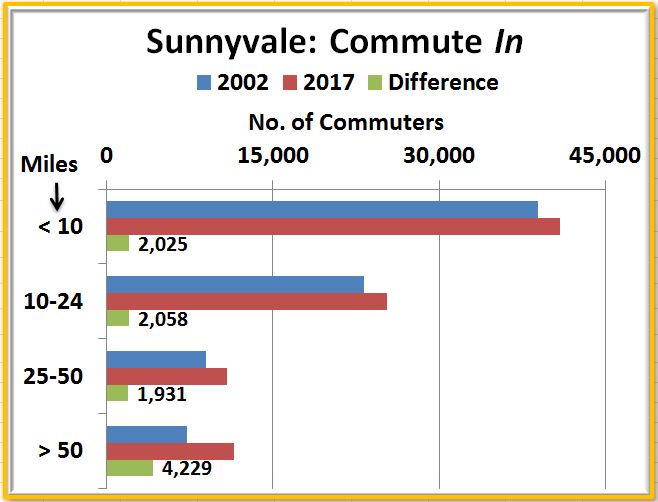
For the inbound commute VMT data table it is interesting to note the 29% increase in inward bound commuting. This was much less than the 47% increase in outward bound commuting VMT seen earlier. We might see the two commute VMTs (in and out) converge!

Graph of table data:


The summary chart above shows there has been a significant increase in VMT for those coming to work in Sunnyvale from other cities. Note that most of the increase has been in the greater than 25 miles "> 25" commute class comprised of the "25-50 miles" and "greater than 50 miles" Census classifications. Those two classes have gone from 57% of VMT to 64%.
The "under 10 mile" commute class in now only 12% of the total VMT. But this "< 10 mile" commute is where all the effort has gone in trying to get people onto buses and biking to work. It is wasted effort as they aren't contributing most of the VMT.
No surprises here. People are continuing to commute from further and further out, despite the increase in housing in Sunnyvale over the 15 year span covered. People want that single family house and if they can't get it here, they will move to where they can get it. If not Livermore, then Austin, TX, or Charlotte, NC.
Total Commuters and VMT
In and Out Combined

Let's put together the in-bound and out-bound commuting VMT.
In tabular form below, we see that the biggest increases were in VMT over 25 miles.

Putting the above data into a chart below shows how the relatively few commuters going more than 25 miles (19% of out-bound commuters, 23% of in-bound commuters) contribute most of the increase in VMT.


Looking at just 2017 we see the information summarized in the bar chart below.

What this shows is that of those commuting both into and out of Sunnyvale, those 11% who commute more than 50 miles generate 38% of the VMT, and the 22% commuting more than 25 miles generate 63% of the VMT. In a mirror image, those that commute 10 miles or less = 55% generate only 16% of the VMT.
The main focus has been primarily to get commuters to take public transit but this focuses entirely on those who are not a problem. (The average bus ride is 5.6 miles). VMT reduction efforts are not addressing the largest contributor to VMT (and therefore GHG emissions) - those commuting more than 25-miles.
This is not very different from the SF Bay Area as a whole as I showed using similar methods.
From:
Commuting Only 27% of VMT
We have only looked at VMT for commuting. Everything above does not include VMT for all the travel used for other purposes by cars. Commuting is only 27% of individual automobile use and has been slowly declining since 1969 as seen in the following two graphs from US government agencies.

If all other auto use stays the same, to achieve a 15% reduction in total light duty vehicle (including cars, SUVs, and pick-up trucks) VMT would require that 27% to go to 12% = only 44% of current use. That equates to a 55% reduction in commuting. Nor does that count the VMT of heavy duty trucks, which have much worse CO2 emissions. The extraordinary difficulty in achieving such extreme reductions is compounded when one considers that pickup trucks are typically used in the trades for work. Plumbers, for example. are not going to start biking from one house with a plugged-up drain to another.
Example Cities
So, where are all these long commutes to and from? "On The Map" tells us that too! We select destinations when we set up an analysis and get the list seen below:
Cities Sunnyvale Residents Commute To
2002 (left) & 2017 (right)

I circled a few in red. In 2002 the number of commuters to Santa Cruz was 111. And 15 years later it was 107. Basically the same. Commuters from Sunnyvale to Livermore numbered 117 in 2002, 158 in 2017. Sunnyvale to Sacramento: 229 in 2002, 245 in 2017. Pleasanton; 631 in 2002, 471 in 2015.
This pretty much puts paid the idea that people desire nothing more than to "walk to work". All the cities circled above have much cheaper housing than Sunnyvale, yet over a span of 15 years, roughly the same number of people commute from Sunnyvale to these cities.
Yet another nail in the coffin of the "build more housing so everyone can walk to work" mantra.
Consequences
The counterfactual myth that building more will lessen VMT would normally be harmless because people will do what they want to do. When it comes to getting a job or choosing where to live, data clearly shows people don't care about VMT in the slightest. What well-intentioned people in Sacramento decree doesn't really matter.
The realization of this myth under the guidance of the bureaucrats will be reduced parking and freeway flow because "everyone will walk or bike to work". In reality what will happen is that parking will become a nightmare as will freeway traffic - more and more people will leave CA because traffic and parking just gets too crazy.

If you can! Might get stuck on "the 5"
Which is probably just as well. If the government agencies in charge of making life better keep making life worse then people will vote with their feet, because they really have little voice in this.
By roughly 2025, battery prices will decline enough that Electric Vehicles (EVs) will reach cost parity with Internal Combustion Engine Vehicles (ICEVs).
By then it will be clear that is the only real solution to transport-generated GHG emissions.

You might think that would free us from this tyranny of VMT. It won't. Urban planning depts. in all universities adhere to the myth of "cars bad, buses good, everyone wants to walk to work". They will find some other excuse to impose their "vision".
But at least you, dear reader, will know it as a cult - like the flat Earth movement.

For now, this is...
