http://meetingthetwain.blogspot.com/2017/08/another-financial-bubble.html
Financial Bubble Again?
A concern I have heard is that there may be a surplus of office space. Some have projected a vacancy rate of about 10% in the SF Bay area - higher in some areas than others. This will only be exacerbated in the Sunnyvale-Cupertino-Mountain View area as much more office space opens up in Central San Jose for companies such as Apple and Google that occupy many buildings in our cities. Will we have a lot of see-through offices?
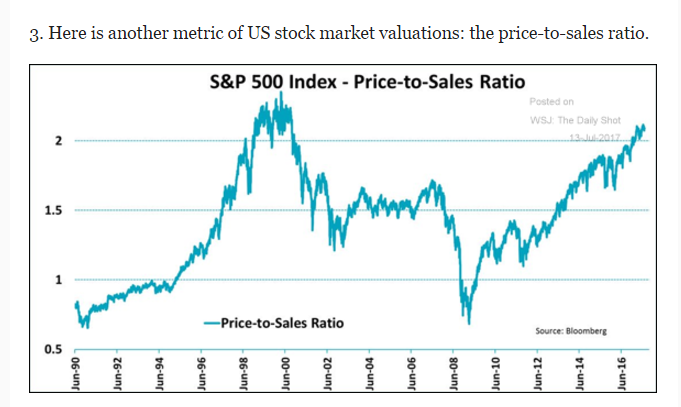
Another (related) concern is that stock market valuations are very high and we might be in a bubble followed by a crash like the dot-com bust of 2000 or the housing crash of 2007-2008. This would leave a lot of unfinished buildings in various states. Sunnyvale has seen this before.
Another (related) concern is that stock market valuations are very high and we might be in a bubble followed by a crash like the dot-com bust of 2000 or the housing crash of 2007-2008. This would leave a lot of unfinished buildings in various states. Sunnyvale has seen this before.
The following chart looks like we are in a 2000 dot-com or 2007 housing bubble again,. The Standard and Poor's stock index is at 103% above normal. The only time it was higher was 2000.
https://www.advisorperspectives.com/dshort/updates/2017/08/02/regression-to-trend-another-look-at-long-term-market-performance
 |
| S&P stock index between 2000 bubble and 2007 bubble? |
Another way to look at the stock market is below. Again, deja vu of the Dot-Com bubble?

Commercial properties becoming the 2007 housing bubble but in commercial real estate? Chart below shows May, 2017.

The above graph is the same as below but corrected for inflation. We find commercial property is above the 2007-2008 real estate value after inflation is factored in.

Are foreign investors in commercial real estate pulling back? It looks a lot like 2007 only worse because now Asia has joined the "festivities". The bigger the boom, the bigger the bust.


The next graph shows current affordability by county by estimating the percentage of families that can afford to buy a house. In San Francisco it is only 13%, Santa Clara 19% all of California it is 32%, in Solano County it is 45%. In the US as a whole it is 57%.

However, growth is slowing down which will give builders a chance to catch up to demand. San Francisco is seeing a cooling in both job growth and rent increases. “Tech is growing more slowly than the rest of the economy and tech has been the thing that has been driving the economy forward the last decade,” said Ted Egan, chief economist for the city of San Francisco. “We are in the middle of a notable slowdown.” https://www.wsj.com/articles/san-franciscos-housing-slowdown-could-spread-1498583304
We can hope for a soft landing but the widely viewed Shiller CAPE chart of the stock market going back to the 1880's shows stocks at currently at a level seen only in 1929 (we're above that) and 2000. Markets did not come down softly from those levels. Dr. Shiller of Yale won the Nobel Prize in Economics for his work in asset valuation - which includes stocks and houses. (Click on graphics to enlarge).

Warren Buffet is famous for his simple indicator of total market valuations divided by GDP. That is shown below. It is very high.

A composite of five different valuations of the US stock market shows high levels of stock deviation from the long term average - similar to the 2000 bubble. Maybe "this time is different"?

I sincerely hope we do not have a major recession but it behooves us to be cautious in making long term plans.