Palo Alto
Jobs and Commuting
 |
| Palo Alto High School Built in 1919 https://www.paloaltoonline.com/paly-gym/palo-alto-gym-history.php |
Palo Alto: Population: 67,024 (2016 est.)
Land Area: 24 Sq. Mi.
Density: 2,793 people per sq. mi.
Things that have remained relatively stable are...
...92% of workers commute in from outside Palo Alto
...Less than 8% those living in Palo Alto work in Palo Alto
If Palo Alto's population increased so that the number of resident workers (currently 28,000+) equaled the number of jobs (currently 106,000+) Palo Alto would have a population of roughly 250,000 vs. it's current 67,000. Assuming the open space stays preserved, that is a population density of about 20,700 people per sq. mile - about equal to the density of the borough of Queens in NYC. San Francisco's density is 19,000/sq. mi.
How Palo Alto workers get to work is:
Land Area: 24 Sq. Mi.
Density: 2,793 people per sq. mi.
PermaLink for this post: https://meetingthetwain.blogspot.com/2018/01/palo-alto-work-live-commute.html
Part of a series looking at Silicon Valley work-commute issues including:
Part of a series looking at Silicon Valley work-commute issues including:
Summary
In the 14 years from 2002 to 2014 Palo Alto has added a LOT more jobs but NOT much housing. Very few people that live in Palo Alto work there, and very few people that work there also live there. We have seen this in all the Silicon Valley cities we have looked at.
In Palo Alto...
...jobs increased by 56% (38,000+) from 68,340 to 106,413.
...resident workers increased by 24% (5,400+) from 23,000 to 28,431.,
...workers commuting in increased by 56% (35,000+) from 63,037 to 98,415,
Things that have remained relatively stable are...
...92% of workers commute in from outside Palo Alto
...Less than 8% those living in Palo Alto work in Palo Alto
If Palo Alto's population increased so that the number of resident workers (currently 28,000+) equaled the number of jobs (currently 106,000+) Palo Alto would have a population of roughly 250,000 vs. it's current 67,000. Assuming the open space stays preserved, that is a population density of about 20,700 people per sq. mile - about equal to the density of the borough of Queens in NYC. San Francisco's density is 19,000/sq. mi.
How Palo Alto workers get to work is:
- 73% drive alone,
- 11% carpool,
- 7% take transit (vs. 4% in SC county),
- 2% walk,
- 3% bike,
- 3% work from home.
This has not changed much over the 55 year period 1960 - 2015.
The total Vehicle Miles Traveled (VMT) over the 14 year period has increased mostly in the longest commutes. As Palo Alto adds residents, more and more commute out of Palo Alto ever further distances. Roughly the same effect is observed for those commuting into Palo Alto. (Click on images to enlarge.)
The total Vehicle Miles Traveled (VMT) over the 14 year period has increased mostly in the longest commutes. As Palo Alto adds residents, more and more commute out of Palo Alto ever further distances. Roughly the same effect is observed for those commuting into Palo Alto. (Click on images to enlarge.)

Bus service is declining in Santa Clara County so the very real problem of getting people in and out of Palo Alto remains unsolved.
Conclusion: Palo Alto is a poster child for bad (or lack of) urban planning on a regional level. Transit infrastructure is insufficient and cannot be made sufficient without paying billions of dollars just so Palo Alto and Menlo Park can continue creating jobs while leaving other cities to build housing and provide services (like schools) for workers commuting to Palo Alto.
Yet with the geographic limits of Palo Alto (hills on one side, bay on the other), and the layout of Palo Alto streets for single family housing it is hard to see how increasing housing to accommodate the number of jobs is possible without creating total gridlock in and around Palo Alto. Which makes it self-evident that further job creation in Palo Alto is not in the best interests of the region, including Palo Alto itself, since widespread resentment may force it to dramatically change itself in unpleasant ways.
Some sort of revenue sharing is needed since Palo Alto gets lots of money from businesses while other cities pay for providing city services for Palo Alto workers.
(The Census Bureau tool used is here https://onthemap.ces.census.gov/ with an explanation of data sources here: https://lehd.ces.census.gov/. Instructions on use of the census tool are here: http://meetingthetwain.blogspot.com/2016/12/how-to-use-onthemap.html ).
--------------- End Summary -----------------
Land Area and Density
An important note on Palo Alto's "land area" and density: the citizens of Palo Alto, to their credit, preserved as natural open space a substantial portion of the city's land area - roughly half. This is located in the foothills to the south-west and the Baylands Nature Preserve on San Francisco Bay to the north-east. See map below (click to enlarge)
 |
| Palo Alto Roughly half is preserved for open space. Note: Stanford University is NOT in the boundaries of the City of Palo Alto |
 |
| Baylands Preserve
Like much of SF Bay, the Baylands was at one time slated to be filled in for housing.
Fortunately, a dedicated group took up the cause and ultimately prevailed to preserve it.
|
 |
| Baylands Preserve Anything built in the preserve will flood. The preserve serves as flood protection for other parts of Palo Alto Sea Level Rise from global warming is happening now. |
The areas preserved would be ill-suited for building. The Baylands marsh area serves as a natural buffer to rising sea levels and storm surges. Without it highway 101 would become subject to frequent flooding as sea level rises. The shot below (from a US Govt. NOAA web site) is of Palo Alto with a 3 ft. sea level rise (click on image to enlarge). This level is pretty much locked in by 2050 per the CA state research document "Rising Seas in California" available at:
http://www.opc.ca.gov/webmaster/ftp/pdf/docs/rising-seas-in-california-an-update-on-sea-level-rise-science.pdf
By 2050 a 3 ft. Sea Level Rise for the SF Bay area is projected resulting in the following: (click any image to enlarge)
http://www.opc.ca.gov/webmaster/ftp/pdf/docs/rising-seas-in-california-an-update-on-sea-level-rise-science.pdf
By 2050 a 3 ft. Sea Level Rise for the SF Bay area is projected resulting in the following: (click any image to enlarge)
 |
| https://coast.noaa.gov/slr/#/layer/slr/3/-13594242.94286424/4500013.010008866/14/satellite/none/0.8/2050/interHigh/midAccretion |
Sea Level Rise from global warming inundates parts of Palo Alto and Mountain View...
...including highway 101
By 2070 it will look like this:
 |
| 6 ft. sea rise - baked in at this point Build a sea wall? It will need to last for 1,000 years. Like the Oroville dam? |
http://meetingthetwain.blogspot.com/2017/04/bye-bye-shanghai.html and here:
https://meetingthetwain.blogspot.com/2018/02/mother-nature-bats-last.html
Even if people wanted to build on the protected open space hills in the south-western part of Palo Alto, those areas are expensive to build on because hills are simply more costly to move men and materials on. Building and living there would require roads that twist and turn. This would make exit and entering very slow and difficult, especially for long vehicles like firetrucks.
 |
| Los Trancos Preserve Not well suited for roads and housing. |
The risk of fire in wooded areas is high and getting higher as global warming raises temperatures and dries out the underbrush. While it would be physically possible to build there, it is dangerous and becoming more so.
 |
| Signorella Winery, Napa, CA - before (left half) and after (right half) 2017 fires https://www.nbcbayarea.com/multimedia/Dramatic-Before-After-Images-Northern-California-Wildfires-450245503.html |
This open space preserve removes about half the area from development and as a consequence the effective land area and population density are more like 12 sq. miles and 5,600 people per sq. mi., respectively. This makes it very roughly equal in density to neighboring communities like Mountain View, Sunnyvale, and Cupertino.
How Many Commute To/From Palo Alto
Let us compare commute in-out flows for 2002 and 2015 (latest available). Click on images to enlarge.
 |
| 2015
98,415 commute in
20,433 commute out
7,998 work AND live in Palo Alto = 7.5% of PA workers |
 |
2002 63,037 commuted in
17,697 commuted out
5,303 lived AND worked in Palo Alto = 7.8% of PA workers |
In 14 years a LOT more jobs but NOT much housing. Specifically,
In Palo Alto...
...jobs increased 56% (38,000+) from 68,340 to 106,413.
...resident workers increased 24% (5,400+) from 23,000 to 28,431.,
...workers commuting in increased 56% (35,000+) from 63,037 to 98,415,
Things that have remained relatively stable are...
...92% of workers commute in
...Less than 8% of residents work in Palo Alto
Increase Density to Lessen Commute?
One thing to note is that while the number of workers who lived in Palo Alto increased by 5,431 only about half that number worked in Palo Alto. A number equal to half of new resident workers commuted out. This means that even if Palo Alto increased their housing supply to accommodate all 106,413 job holders (an increase of nearly 78,000 workers or almost 3 times the current working population) only half of that number of new workers (about 39,000) would likely work in Palo Alto, based on past experience. The other 39,000 would commute out. Commute routes would not get much better.
There would still be a lot of commuters coming in. However, the commuting would be a lot more balanced with those coming in about equal to the number going out. One big question is what would Palo Alto become with nearly 4 times more residents? Would we be saying good-bye to any neighborhood charm or quality of life?
If Palo Alto's resident population increased so that the number of resident workers (currently 28,000+) equaled the number of jobs (currently 106,000+) that would mean (all things being equal in terms of family size) a population 3.7 times the current population. I.e., Palo Alto would have a population of roughly 250,000 vs. it's current 67,000. Assuming the open space stays preserved, it would mean a population density of about 20,700 people per sq. mile. That is nearly double the density of Chicago, and a higher population density than San Francisco. https://en.wikipedia.org/wiki/List_of_United_States_cities_by_population_density
Palo Alto, at that density would have approximately the density of the NY City Borough of Queens - without the transit system but with hills on one side and SF Bay on the other blocking any nearby housing expansion.
The NYC Borough of Queens can be a nice place and has some nice single family home residential areas.
But much of it looks like this:
The question is not how dense you can make a place? With modern building technology you can make it very dense indeed.
The question is not "can you" increase density. The questions are:
1. How do you get people in and out?
2. Why do you want to increase the density?


There would still be a lot of commuters coming in. However, the commuting would be a lot more balanced with those coming in about equal to the number going out. One big question is what would Palo Alto become with nearly 4 times more residents? Would we be saying good-bye to any neighborhood charm or quality of life?
If Palo Alto's resident population increased so that the number of resident workers (currently 28,000+) equaled the number of jobs (currently 106,000+) that would mean (all things being equal in terms of family size) a population 3.7 times the current population. I.e., Palo Alto would have a population of roughly 250,000 vs. it's current 67,000. Assuming the open space stays preserved, it would mean a population density of about 20,700 people per sq. mile. That is nearly double the density of Chicago, and a higher population density than San Francisco. https://en.wikipedia.org/wiki/List_of_United_States_cities_by_population_density
Palo Alto, at that density would have approximately the density of the NY City Borough of Queens - without the transit system but with hills on one side and SF Bay on the other blocking any nearby housing expansion.
 |
| Palo Alto's Future? https://en.wikipedia.org/wiki/Queens |
 |
| 22 Chevy Chase St., Queens, NYC |
 |
| Palo Alto's future? |
The question is not how dense you can make a place? With modern building technology you can make it very dense indeed.
 |
| Chong Qing, China Dense enough for you? |
1. How do you get people in and out?
2. Why do you want to increase the density?
How Will People Get In and Out?
The aerial view of Palo Alto shown below has outlined in red lines the areas where housing is most likely to be added. The other areas of Los Altos, Los Altos Hills, Atherton, and Stanford are not going to be developed significantly (complain all you want - not going to happen). That makes areas with easy access to Palo Alto via side streets very, very limited. |
| Areas that are likely to add housing outlined in red |
So what we're left with is commuting mostly from south Santa Clara County, across the Bay from Alameda County, and Peninsula cities to the North, including San Francisco. The only viable routes are CalTrain, 101, the Dumbarton Bridge (Hwy 84) and 280.
Highway 280 isn't really an access to Palo Alto, but rather to Arastradero Road which is crowded and causing backups on 280. Highway 101 is pretty full. CalTrain is full now - trains can't get longer, or hold more people at rush period. Capacity will expand with electrification but even then, not everyone is near a CalTrain station. As seen later, only 7% of Palo Alto workers take transit while over 70% drive solo.
It is hard to see 280 or 101 providing greater access, even if 101 near Palo Alto somehow stays viable with even a little sea level rise. Will everyone else in the county or SF Bay Area care to tax themselves to expand those highways or add mass transit so that Palo Alto can continue to welcome companies but not provide housing for the workers?
Buses?

Maybe more buses? VTA buses serve Palo Alto. "Fare recovery" on VTA is slightly under 9%. Which means 9% of funding for buses comes from fares - every $2 bus ticket gets $20 in subsidy from taxes, mostly sales tax. Much more at: http://meetingthetwain.blogspot.com/2017/09/a-bit-on-buses.html
That tax subsidy for VTA is pretty much fixed by how much sales tax comes in, regardless of ridership. With VTA budget pretty static more buses in one location means fewer buses in another location. To get more buses to serve Palo Alto, other routes serving other areas would have to be cut. And bus and light rail ridership isn't rising, it is declining. Currently, only 4% of Santa Clara County commuters go by bus. Bus ridership has declined to 85% of its 2009 peak, and light rail ridership is down to 83% of its 2014 peak despite VTA service area job growth.

Buses are not going to solve any sort of transit problem for Palo Alto.
Commuting To Palo Alto
The following map shows residential density of those commuting INTO Palo Alto. Clearly, many people who work in Palo Alto live nearby, but a surprising number live in hard to commute from locations - Pleasanton, Livermore, San Jose. The "Radar" chart following this shows that a large number with the worst commutes come from San Jose. (Click on chart to enlarge).
 |
| Commuting INTO Palo Alto Darker Color = More PA-Bound Commuters living there |
The following chart and table shows that only 37% of workers commute less than 10 miles to get to work in Palo Alto (dark green in the Radar chart). That is low. In San Jose over 50% commute less than 10 miles, in Mountain View 40%, in Cupertino around 50%, in Sunnyvale 47%. The difference is partly explained by the geographic isolation of Palo Alto with the Bay on one side and the mountains on the other. The direction of the biggest "pie slice" on the Radar chart below shows most are commuting from the south to Palo Alto.

What is a 10 mile commute area? See map below.
 |
| 10 Mile Commute Radius Around Palo Alto 37% of those working in Palo Alto live within this area 63% of those working in Palo Alto live outside this area |
A 25 mile radius from Palo Alto goes to Livermore, San Francisco, and Santa Cruz as seen in the map below. In 2015 about 25% of those commuting into Palo Alto came from further out than that 25-mile circle shown below. (click on image to enlarge)
 |
| 25 Mile Radius around Palo Alto About 25% Commute to PA from Outside that Circle |
A greater than 50 mile commute takes you to, or past, Stockton, Monterey, Vallejo, etc. as seen in the map below. In 2015 about 10% of those commuting into Palo Alto came from further out than that 50-mile circle shown.
 | |
|
That covers commuting INTO Palo Alto for work.
Commuting From Palo Alto
Let's look at commuting OUT OF Palo Alto for work. The same census tool provides that data as well as seen below, with the settings changed so Palo Alto is the home not the work place. Click on graph to enlarge.
 |
| 2015 Commute OUT OF Palo Alto Blue areas show density of jobs |
Notable is that despite paying a lot for housing in Palo Alto, a significant number (41% in 2015) travel over 10 miles while 28% travel over 25 miles to leave Palo Alto to go to work. It is not shown here but that 28% are mostly commuting to San Francisco though some go to Oakland or the Concord area. Another 8% go over 50 miles and census data for those commuters shows they go mainly to Stockton, Salinas and Monterey.
Housing is cheaper almost anywhere outside Palo Alto. Nonetheless, people are willing to pay a lot to live in Palo Alto while commuting long distances to places which would be cheaper to live in. This argues against the idea that everyone puts a very high priority on living near work and "if only housing were cheaper" they would do that. Many do put a high priority on living near work but over 40% (2 out of 5) don't. Recall that only 8% of those living in Palo Alto work there. Others are there for the schools, or it is close to a spouses work, etc., etc. - as many different reasons for commuting as there are people. The key point is that many, many people do not live close to work.
Residents of Palo Alto are more likely than most to be able to afford to live near where they work but many choose instead to commute - sometimes long distances. There is no reason to expect that would change if Palo Alto built 3 or 4 times more housing.
Vehicle Miles Traveled
Vehicle Miles Traveled (VMT) has long been one of several standard ways of measuring sprawl, and the commuting problems, transport pollution and greenhouse gas emissions associated with it. We look at how that has changed in the 14 years from 2002 to 2015.
VMT is calculated by multiplying the number of vehicles by the number of miles each travels. Two cars each going 10 miles = 2 vehicles x 10 miles traveled = 20 VMT
Palo Alto residents' commute modes are:
- 74% car (including 6% carpool),
- 5% public transit,
- 7% biked,
- 5% walked.
(Bike trips are typically 5 miles or less as detailed here: http://meetingthetwain.blogspot.com/2017/01/live-work-commute-3.html )
Commute modes of all those who work in Palo Alto (residents and not) are below:
 |
| http://www.vitalsigns.mtc.ca.gov/commute-mode-choice |
The pie chart in the lower right of the above graphic indicates (when you hover over it on the website linked to):
- 73% drive alone,
- 11% carpool,
- 7% take transit,
- 2% walk,
- 3% bike,
- 3% work from home.
 |
| Car commutes are around 80% in all counties except San Francisco http://www.vitalsigns.mtc.ca.gov/commute-mode-choice |
Palo Alto Commuting Changes over Time
Here are the charts and statistics from the "On the Map" census tool for 2002 and 2015:
 |
| 2002 Numbers for Commuting (Above) Out of Palo Alto (Left) and Into Palo Alto (Right) |
 |
2015 Numbers for Commuting (Above)
Out of Palo Alto (Left) and Into Palo Alto (Right)
|
Comparing the numbers of those commuting OUT of Palo Alto we see an increase from 13.5% of residents to 17.5% of residents going more than 25 miles to get to work. And mostly by car. Only 5% of residents take transit despite being on a major train line and bus route. This "urban village" thing doesn't work.
Putting these numbers into a spread sheet we get the following bar charts:
 |
| 57% increase in Vehicle Miles Traveled Mostly by those Commuting INTO Palo Alto |
We see above a very large increase in total VMT over the 14 year period consistent with the increase in the number of jobs.
The next chart shows the distribution change over time of VMT of all commuters - both commuting INTO Palo Alto and commuting FROM Palo Alto.
 |
| Largest Increase in VMT from those Commuting the Furthest This includes both commuters IN and commuters OUT |
This shows a large increase in VMT, and disproportionately larger increases in those commuting the furthest.
For those commuting into Palo Alto, the percentage of those commuting over 25 miles has increased 83% - from 13.5% to 24.7% of the total number of inbound commuters. The actual number of those commuting over 25 miles has increased 61% from 3,082 in 2002 to 4,963 in 2015.
 |
| The increase in VMT from 2002 to 2015 of workers commuting INTO Palo Alto |
As is clear from the chart, as Palo Alto increases the number of jobs, it is drawing people from further and further away. Disproportionately more from further away in that those commuting 25 to 50 miles increased their VMT 81% while VMT for those commuting 10 miles or less only increased VMT 46%.
Of note in the previous chart and the one below is that average commutes are getting worse (more miles = greater VMT) for everyone - not only those commuting into Palo Alto but also those commuting out from Palo Alto. This runs counter to the idea that if one builds housing near work, everyone will walk-bike-bus to work.
A graph of Palo Alto residents commuting out:

This illustrates the random component of "work-live-commute". People may locate in Palo Alto for the schools or to be near work but as kids grow up and jobs change they tend to keep their home in a location even when the motivation for moving there has disappeared. Part of that is to avoid capital gains taxes, partly to avoid property tax reset, but mostly because that is now their "home" and they don't want to leave the network of friends, and neighbors.
 |
| Home - friends, schools, parks - familiarity and family |
The other factor is simply the geographical isolation of Palo Alto. If Palo Alto were on a wide flat plain, those who couldn't afford a place within Palo Alto could move slightly further out where it would be more affordable. For those who couldn't afford that a slightly further move out would find more affordable land. Each incremental move out from the center would be to cheaper land, (a few exclusive expensive suburbs would emerge as well). This is what happened in the Chicago area over time as seen in the chart below:

Imagine the same chart but with the pink "Inner Suburbs" replaced with an empty area and that is Palo Alto. With the Bay on one side and the mountains on the other side there are very few locations nearby to commute to or from so people need to go across the Bay or further away on the peninsula to find cheaper housing or a better job. Hence the large increase in VMT.
(Note on methodology: where the census data showed commute distances of 0 to 10 miles I used 10 miles, where it showed 10 to 25 I used 25, etc. The reason is because I want to show the relative change. The absolute miles aren't that important and "cancel out" in calculating the ratios)
Why Increase the Density of Palo Alto?
Having answered the question of how people get in and out (i.e., transit is pretty much maxed out) we move on to why should (or shouldn't) the population density of Palo Alto be increased.
One reason promoted for increased density is to supposedly bring down housing prices so that more people can live in Palo Alto near their work. Some hope this would reduce congestion and greenhouse gas emissions. This runs counter to experience - if increased density lowered housing prices, reduced traffic, and pollution, why doesn't NYC have low cost housing, light traffic and clean air?
 |
| http://www.nydailynews.com/life-style/real-estate/yup-guessed-numbers-show-new-york-city-worst-traffic-country-article-1.451554 |
 |
| http://fox40.com/2017/11/01/these-are-the-10-worst-commutes-in-the-u-s-did-your-city-make-the-list/ |
I explained why increased density won't decrease housing costs in other postings (see among others: http://meetingthetwain.blogspot.com/2017/01/live-work-commute-2.html) but here is a brief summary of those posts.
If you increase the density, two things happen.
First Thing: More people will be trying to fit on a fixed amount of land so the bidding for land will raise the price of land. What about building up? That results in more rental income per acre which triggers the second thing.
Second Thing: Building higher gives more rental income from the greater number of units per building. NOTE, the price of land is based on the income that the land can generate ("bid-rent pricing") so the price of land will rise along with the total apartment building income. Therefore building up doesn't make rents cheaper because the landowner "captures" the supposed economies of building up. As noted, lower Manhattan and Hong Kong are very expensive, despite (actually because of) their high density housing.
As traffic worsens due to increased density, many (not all) people will pay more to be close to work (if they can), or to be close to transportation (like CalTrain) to avoid the commute.

In general, those with stock options and high salaries will outbid lower wage people to live in Palo Alto (leading to "gentrification"). Those who can't compete on price will be forced to commute further ("displacement"). In this way Palo Alto becomes more expensive as you increase the density (and with it the traffic delays). That is what is happening now and why Palo Alto is becoming ever more expensive.
For example, Sacramento is relatively inexpensive compared to the SF Bay Area because it has lots of easily accessible land, and relatively few high paying jobs to bid up the values. Palo Alto has very little build-able land and lots of well paid workers per acre so available land is bid up.
 |
| Same Size House in Palo Alto is 8 times the price of Sacramento It's the price of land! |
Ultimately one has to ask why are people enduring cramped, expensive housing and horrible traffic in the SF Bay area and Palo Alto in particular? Some point out the weather is mild, but that has been true for centuries and the area was mostly farming.
What changed was that a number of companies became very successful very fast and decided that they were willing to pay considerably more for office space in Palo Alto and Menlo Park than in San Jose. The chart below shows that office space in Palo Alto is more than double the price in San Jose (where most people in Santa Clara County live) yet companies are willing to pay that extra cost for the privilege of a Palo Alto address.
 |
Palo Alto Office Space Costs 2X per square foot San Jose Office Space
|
Finally, I will point out that among richer countries, housing in the US is relatively inexpensive compared to rents and income. The US is a big, beautiful, and inexpensive country for SF Bay Area companies and workers to expand into. If they did this - simply expand (not move) outside the SF Bay area, that would take the pricing pressure off of housing locally:

C.f., http://meetingthetwain.blogspot.com/2017/08/housing-bubbles-world-wide.html
----
Conclusion: Finding the "Bad Guy"
 |
| Once it was easy to know whom to Boo! |

Whom do we blame?
Blame the Residents? Palo Alto's residents bought nice little houses on a nice quiet streets. Those streets weren't designed to handle a lot of traffic or parking and cannot be retrofitted to do so. They have every reason to not want to have their house in the perpetual shade of 8 story apartment buildings everywhere.City Council? The city council wants the revenue from having businesses and sales tax revenue in town to fund the city services - including pensions that the state legislature authorized in 2000.
Businesses? If the prestige of a Palo Alto address brings more business why not pay the higher rents?
Workers? Palo Alto workers sought and accepted jobs there. Every day they go to work in Palo Alto they are making a decision to keep on working there. They are making a trade-off between high-rents-with-less-commute and lower-rents-and-longer-commutes. They may not like the trade-off but they are adults so must accept the consequences of their fully informed decision.
What you see in the above description is a lot of groups each reasonably seeking their own best interests. Is there a bad guy there?

Notice that there is the complete absence of an "adult in the room" to look at the big picture and decided what is best in the overall long term for everyone.

So if everyone is doing what works best for them why even talk about blame? Because of...
Fairness (1)

In the first case, because of equity - fairness.
The clogged roads due to Palo Alto's grotesque job-to-resident ratio delay everyone who travels on them. Those commuting between Sunnyvale and Redwood City suffer a loss of quality of life too as they wait in stop-and-go traffic generated by Palo Alto's workers trying to get home.
In addition there is increasing pressure to spend billions of dollars to improve roads, bridges, and BART from all the places people live so they can get to relatively inaccessible and unaffordable Palo Alto and Menlo Park. Should the residents of the entire SF Bay area spend billions of dollars to enable Palo Alto (and a few other small communities) to continue adding jobs without regard to housing?
 |
| Will taxpayers vote to spend $Billions for more bridges, trains, and highways? (picture from SJ Mercury News 12/17/2017) https://www.mercurynews.com/2017/12/17/bay-area-traffic-fix-mega-measure/ |
People often point out Manhattan as an example to emulate in transit. To these people, spending $Billions for BART and more bridges makes sense. But there is a big difference. There are 22 bridges connecting Manhattan to neighboring communities, and the best mass transit system in the US - built over 3 centuries. Manhattan also has 1.7 million people coming into an area of 24 sq. miles (the same size as Palo Alto) with over 2.2 million jobs. The enormous ongoing expense ($16B budget for NYC's Metropolitan Transit Authority, $8B from taxes) in NYC is justified by the huge numbers of people involved.
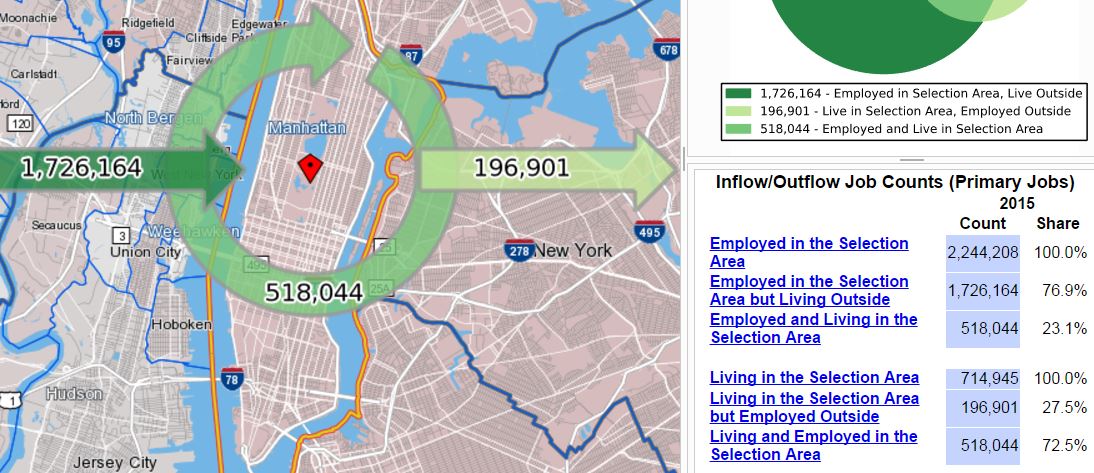 |
| 714,000 Workers Live in Manhattan (total pop 1.7M) 1.7M Workers commute In |
In the case of Palo Alto, we are talking about one little college town with 106,000+ jobs and only 28,000+ workers. Throw in Menlo Park next door and still pretty small potatoes. Manhattan has 1.7M residents and is surrounded by many hundreds of square miles of build-able land containing 24 million people. Palo Alto and the SF Bay area can never match that - why would it want to?
Fairness (2)
In the second case - see the first case. It's equity again. Housing takes a lot of city services meaning a lot of city money - more than residential property taxes bring in (except in richer communities like Los Altos Hills). On the other hand, businesses provide taxes including sales taxes if the corporate headquarters is located in the city. Businesses typically require very few city services. A proper mix of each makes a community financially stable. For Palo Alto to have it's unbalanced mix of mostly jobs and little housing, some other communities have to foot the bill for the extra housing that Palo Alto doesn't provide.
 |
| City Services: City Hall, Parks, Schools, Water Treatment, Culture, Health, Fire and Police Safety, Streets, Public Transit It costs a lot to maintain residential communities. Business areas - not so much. |
ABAG (now MTC-ABAG) gets a lot of criticism but not for what they most deserve it for. That is the complete failure to allocate housing, and jobs so as to optimize commutes. That is their mission - to set jobs and housing to minimize VMT and associated pollution. At this task they have failed miserably. Just putting up housing doesn't do any good if you can't get from the housing to the jobs. Maybe they don't have the power, or the will, or maybe they are getting bad advice but whatever the reason, Palo Alto is a poster child for bad planning on a regional level.
 |
| Good Guy (Left) and Bad Guy (Right) More complicated than it used to be. |
What should happen?
One thing that shouldn't happen (even though it sounds fair), is for Palo Alto to cram in 3 to 4 times the current population to get something close to a decent jobs-to-worker ratio. All that would do is increase the number commuting out on freeways and make local city streets impassable. It would raise the density over that of San Francisco and increase housing prices even more.
There needs to be some limit put on Palo Alto's job creation or the rest of the SF Bay Area will be spending billions of dollars on increased infrastructure to support Palo Alto's job creation to the benefit of Palo Alto and Menlo Park and no one else.
 |
From $250 Million to $6.5 Billion: The Bay Bridge Cost Overrun
Infrastructure ain't cheap
|
Looking at the SF Bay Area as a whole, equity will need to be imposed on a regional basis, not just each little town and city. Currently, it apparently only looks at housing and not even that very well. It should consider commuting at least as much as housing.
Some sort of revenue sharing between communities with excess jobs and those with more housing than jobs. There is a model for this in internet sales taxes which go to the county and are shared among the cities.
What should happen is a big topic for another post.
------------- the end --------
Why housing costs a lot in SF Bay area - "Urban Economics":