Roof Top Solar
 |
| 1884 - World's first solar panels in NYC https://electrek.co/2018/01/29/10-really-cool-solar-power-installations/ |
http://meetingthetwain.blogspot.com/2018/01/climate-action-1-polls.html
Rooftop solar is getting cheaper and is becoming a significant part of the energy generated in many states, including California.
First the (reealllyy) good news. In 2006, the US Dept. of Energy made predictions of where our energy would come from in 2016. Here it is 2016 and solar and wind generation in 2016 have blown way past the US Dept. of Energy's 2006 projections for where we would be now. And coal, CO2 emissions, and total energy consumption have decreased tremendously!
 |
| https://www.statista.com/chart/11365/the-us-is-smashing-its-clean-energy-targets/ |
 |
| California has an excellent renewable energy resource in solar NREL is the US Govt. National Renewable Energy Lab |
 |
| California doesn't have great onshore wind but it has more high quality off-shore wind (Red and Dark Blue) than any other part of the US. |
The state of South Australia (1.7M people) is already at 57% renewable energy and "The Australian Energy Market Operator predicts that the state is heading towards 80 per cent renewable energy by 2021/22".
http://reneweconomy.com.au/south-australia-already-57-wind-solar-201617/
We have the potential in California to get 74% of our energy from just rooftop solar on all buildings. Like Arizona and Utah we get a lot of sun but, unlike them we have a lot of buildings too!
 |
| http://www.renewableenergyworld.com/ugc/articles/2016/04/sharply-higher-rooftop-solar-potential-increases-opportunity-for-energy-selfreliance.html |
Why not just let the power companies do it all by putting solar panels in the desert? One reason is that the desert isn't deserted. It has lots of critters on it that had nothing to do with changing the climate. That is why the Sierra Club, the Natural Resources Defense Council and Defenders of Wildlife sued to prevent the Calico Solar Project. The Desert Tortoise ("Threatened" on Endangered Species list) and other species need a large amount of contiguous land to forage in and sustain a large enough population to enable individuals to find partners for breeding.
https://www.washingtonpost.com/news/energy-environment/wp/2016/08/15/the-greens-and-solar-industry-agree-on-climate-but-they-cant-agree-on-the-california-desert/
 |
| Hey! It wasn't me what changed things. Clean up your own mess! (Desert Turtle) |
https://www.forbes.com/sites/toddwoody/2012/03/27/sierra-club-nrdc-sue-feds-to-stop-big-california-solar-power-project/2/#26aeb59b6dd6
 |
| Mojave fringe-toed lizard Another desert species in the area |
 |
| Golden Eagles nest in Calico area |
 |
| Big Horn Sheep |
 |
| White-margined Beardtongue - very limited range Does not transplant or propagate from cuttings https://www.blm.gov/ca/pdfs/cdd_pdfs/whitemarg1.PDF |
Details on Distributed Energy:
 |
| Old style centralized power plant |
 |
| Tesla's Solar Roof "Textured Glass Tile" style https://electrek.co/2016/10/28/tesla-solar-roof-options-gallery/ |
 |
| Covered with Tesla solar panels! Who knew! https://electrek.co/2016/10/28/tesla-solar-roof-options-gallery/ |
 |
| These are the Tesla solar panels on the house above. |
And it has gotten a lot cheaper over the years as seen below (click graph to enlarge):
 |
| https://www.nrel.gov/docs/fy17osti/68925.pdf page vi |
Note in the above graphs that for residential construction, most of the cost is sales. Having a lot of sales staff running around making bids on each house is expensive. Further, in some cases the structure must be strengthened to support the extra weight of solar panels, holes drilled in the roof must be covered and sometimes the electrical system upgraded. Bringing an installation crew out to each house is expensive also.
 |
| Getting a crew out to each house is a lot of overhead adding to costs. |
Putting solar panels on all new construction and gradually adding it to existing buildings sounds great, right?! Save life on the planet and lower your electric bills while still looking good. The US govt. (and that of many other countries) gives tax breaks to encourage roof-top solar, as does the state of California and most states in the US. Even Republicans in Congress are in favor of it as witnessed by their keeping in the tax breaks in their new tax package. Who could be against roof-top solar?
It turns out the electric companies are against it. The obvious reason is because they don't get any money from you supplying your own electric power. In 2014, Mark Ferron, the former head of the California Public Utilities Commission said, "I suspect that they [utilities] would still dearly like to strangle rooftop solar if they could." and "the commission will come under intense pressure to use this authority to protect the interest of the utilities over those of consumers and potential self-generators, all in the name of addressing exaggerated concerns about grid stability, cost and fairness."
More here: https://www.greentechmedia.com/articles/read/read-this-retiring-utility-commissioners-candid-words-about-energy-policy
The utilities' argument is the "Duck Curve".
 |
| Let's see. People like ducks, right? And nothing wrong with a curve. So if I combine the two it will look perfectly innocent. Damn, I'm good! |
Still, I need to give a "Reader's Digest" version of it before ending.
The "Duck Curve"
This has been used by those in the power generation industry to argue against adding more solar power right now. The 2013 projection of a severe dip in daytime "load" by 2020 followed by a steep rise around 5 PM actually came true earlier - in 2017.
The argument is that a lot of costly storage and/or "peak power" plants will be needed to very quickly ramp-up power generation after 5 PM. And therefore (the power companies argue) we shouldn't encourage solar panels everywhere because it will just be too costly now. The power companies acknowledge that eventually we will need to get to 100% renewables, just not quite yet. When storage gets cheaper in the (indefinite) future, they suggest.
About the duck curve argument, Mark Ferron, former head of the CPU said "We need to declare hunting season on the Cal ISO’s duck chart!” ..."Judging from the cheers he got from the pro-solar crowd, he’s not the only one who wants to see the chart shot out of the skies of the policy debate on the state’s solar-powered future." C.f., Chttps://www.greentechmedia.com/articles/read/retired-cpuc-commissioner-takes-aim-at-caisos-duck-curve
The counter arguments basically boil down to "Yo! Big power utilities! That's your problem - deal with it!"
Maybe a little more detail would be in order so...
It's important to note that the "duck curve" as commonly shown is misleading on several counts. First of all, the bottom of the above "duck curve" is not zero. Shown to scale it is nothing like as dramatic as seen earlier. Compare the two examples in the following diagram for 2016. The left diagram looks sooo dramatic (a crisis! "Something Must Be Done!") because the lower bound is 14,000 MW, not zero. The right graph shows the curve in context (base at 0 MW) and it isn't scary at all.
 |
| https://ilsr.org/report-electric-vehicles/ |
 |
"Duck Curve" is very pronounced in December, and March
But no duck curve at all in June and September.
|
 |
| Above from US Energy Information Agency Steep ramp in late afternoon but used to be steep ramp in early morning https://www.eia.gov/todayinenergy/detail.php?id=19111 |
Here is a another set of monthly averages. Load" = all electricity demand. (Note the bottom of the left axis is not zero.) "Net Load" is load minus (solar + wind) (click to enlarge):
 |
| Can you find the "duck"? From page 15 of: http://docs.cpuc.ca.gov/PublishedDocs/Efile/G000/M157/K905/157905349.PDF |
 |
| Thursday, December 14, 2017 Light Blue "Thermal" refers to burning coal or natural gas. ""Duck curve" (such as it is) same in early morning and late afternoon. http://content.caiso.com/green/renewrpt/20171214_DailyRenewablesWatch.pdf |
 | |
|
So the duck curve is a seasonal thing and not all that severe when it occurs, but what can be done about it when it does happen? We can level out the duck curve by storing the power during the mid-day and then putting it back into the grid in the evening peak. How much storage would that take and how much would it cost?
 |
| Storage Green Section is used to remove the 'head' of the duck later. http://large.stanford.edu/courses/2015/ph240/burnett2/ |
Total annual revenues of the 3 major CA utilities is over $29B as seen in page 10 of:
http://www.cpuc.ca.gov/uploadedFiles/CPUCWebsite/Content/About_Us/Organization/Divisions/Office_of_Governmental_Affairs/Legislation/2017/AB67_Leg_Report_PDF_Final_5-5-17.pdf
Spending $10B for storage would mean spending an extra $1B per year on storage for 10 years. That's only 3.4% of California's utility companies' revenues. Increase everyone's utility bill 3.4% for 10 years and problem solved. (Then reduce the bill 3.4% in 10 years when you're done. Ha-ha, as if...)
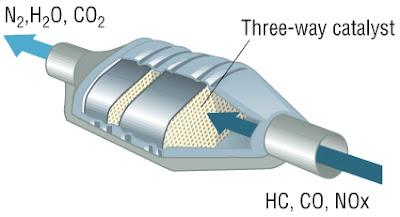
Let's put this in context. There are 17 million cars in California. Each one has a catalytic converter to clean the exhaust fumes to reduce pollution. We, the people of the US, mandated this even though it costs us all extra money for a car. We did this because pollution kills people (us) and other living things.
 |
| Catalytic Converter mandated on all cars in US Converts Carbon Monoxide (poisonous) and oxides of Nitrogen (poisonous) Into Nitrogen and Water (harmless) and CO2 (main Greenhouse Gas) |
 |
| Solar + Batteries = Match Made in Heaven |
There are other ways to flatten the duck curve such as demand management, and changing time of day pricing to change behavior, but ultimately storage is needed. In fact there has been a need for storage for many years because of variable loads as everyone turns on the TV at the same time to look at the "big game" or has all the kitchen electric things going for Sunday dinner.
 |
| Microwave, blender, oven, mixer, toaster oven, refrigerator, ice maker, dishwasher, followed by TV, computer, clothes washer and dryer = duck's head |
 |
| Peaker plant next to a solar plant. One of them ain't gonna be there in 10 years. https://www.greentechmedia.com/articles/read/dueling-charts-of-the-day-peaker-plants-vs-green-power |
 |
| Solar + storage is already a little cheaper than "Peaker" plants. By 2023 they will be a LOT cheaper. Why wait? |
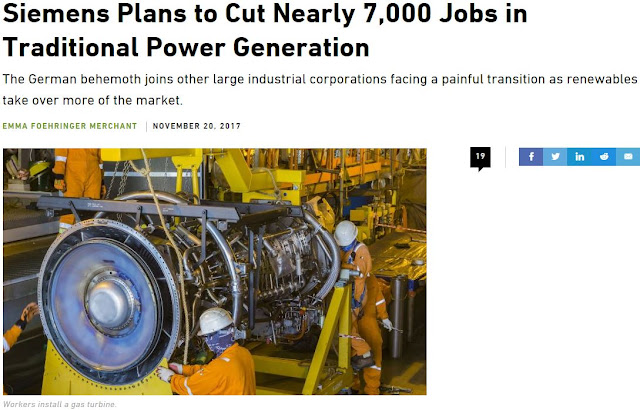
And in fact, both Siemens and GE laid off 7,000 and 12,000 workers respectively in their power businesses within a month of each other because of renewables and storage taking away business.
 |
| https://www.bloomberg.com/news/articles/2017-12-07/ge-is-said-to-plan-12-000-job-cuts-as-new-ceo-revamps-power-unit |
“Renewables are putting other forms of power generation under increasing pressure,” Siemens management board member Lisa Davis told Reuters.
In a call to reporters, Janina Kugel, another board member, put it in starker terms: “The market is burning to the ground.”
https://www.greentechmedia.com/articles/read/siemens-layoffs-renewables-traditional-power-generation
 |
| https://www.greentechmedia.com/articles/read/siemens-layoffs-renewables-traditional-power-generation |
I could go on (and on and on...) but this is already too long so...


