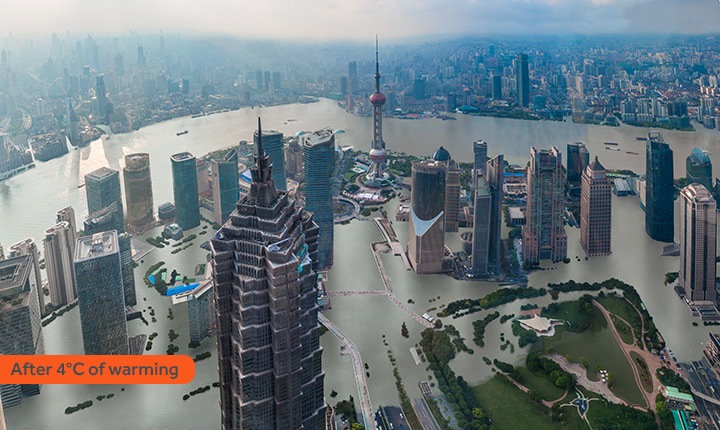
Bye-Bye Shanghai
Sea Level Rise will affect humanity around the world. Major highly populated parts of the world will be inundated if we do nothing ("Business As Usual" - BAU) as opposed to taking drastic action now. I look at the SF Bay Area and other coastal areas around the world.
(See update and extension here:
http://meetingthetwain.blogspot.com/2018/02/mother-nature-bats-last.html )
Below is a view of central Shanghai, China at sea levels which will be locked in by 2100 due to an increase in global temperatures of either 4 degrees Celsius (7.4 degrees Fahrenheit) or an increase of 2 degrees Celsius (3.6 degrees Fahrenheit). That rise may not be seen in 2100 (though maybe it will) but will be irreversibly "locked in" by decisions made now. Go all out now to eliminate Greenhouse Gas emissions now and we will get the 2 degree scenario.

Keep doing what we're doing - sort of half-hearted GHG reduction - and we get the 4 degree scenario for Shanghai, that is shown below.
It is even worse for the area north of Shanghai as seen below:
Link to this post: http://meetingthetwain.blogspot.com/2017/04/bye-bye-shanghai.html
http://meetingthetwain.blogspot.com/2018/02/mother-nature-bats-last.html )
Below is a view of central Shanghai, China at sea levels which will be locked in by 2100 due to an increase in global temperatures of either 4 degrees Celsius (7.4 degrees Fahrenheit) or an increase of 2 degrees Celsius (3.6 degrees Fahrenheit). That rise may not be seen in 2100 (though maybe it will) but will be irreversibly "locked in" by decisions made now. Go all out now to eliminate Greenhouse Gas emissions now and we will get the 2 degree scenario.

Keep doing what we're doing - sort of half-hearted GHG reduction - and we get the 4 degree scenario for Shanghai, that is shown below.
 |
| http://www.chinafile.com/reporting-opinion/environment/chinese-cities-most-risk-rising-sea-levels |
 |
| http://flood.firetree.net/?ll=32.6408,121.2058&zoom=7&m=5&type=hybrid |
Weep and wail for Sunnyvale
Below are two possibilities for Sunnyvale that could be locked in by 2100. Locked in by 2100 does not mean it will happen by 2100 (though it could - things are turning out worse than predicted), only that it will be unavoidable by then, regardless of what global warming mitigation actions are taken.
Based on current actions (or lack thereof), the right side is almost locked in now as a 2 degree Celsius warming. The left side shows what happens if no serious measures are done to mitigate green house gas emissions. All of north Sunnyvale is under water as is most of 101 and 237. On right side, we see what happens if we do everything possible to reduce GHG starting now. Major portions of north Sunnyvale are lost, but 101 is dry. In-between measures gets us in-between results. Click on image to enlarge:
 Screenshot from interactive tool at:
Maps based on peer-reviewed scientific article available at above link - click on "Learn about this map" in upper right of map at that site.
Timing is not 100% certain, however most timing estimates have been conservative. Regrettably, all the surprises so far have been that it is getting worse faster than predicted. For example, the recent bleaching of the coral of the Great barrier Reef came 30 years earlier than expected.
Cf:
As for sea level rise, "In 2013, scientists reached a consensus that three feet was the highest plausible rise by the year 2100. But now six or seven feet [i.e., 2 meters]
"Scientists nearly double sea level rise projections for 2100, because of Antarctica" 
Below are two possibilities for Sunnyvale that could be locked in by 2100. Locked in by 2100 does not mean it will happen by 2100 (though it could - things are turning out worse than predicted), only that it will be unavoidable by then, regardless of what global warming mitigation actions are taken.
Based on current actions (or lack thereof), the right side is almost locked in now as a 2 degree Celsius warming. The left side shows what happens if no serious measures are done to mitigate green house gas emissions. All of north Sunnyvale is under water as is most of 101 and 237. On right side, we see what happens if we do everything possible to reduce GHG starting now. Major portions of north Sunnyvale are lost, but 101 is dry. In-between measures gets us in-between results. Click on image to enlarge:
Based on current actions (or lack thereof), the right side is almost locked in now as a 2 degree Celsius warming. The left side shows what happens if no serious measures are done to mitigate green house gas emissions. All of north Sunnyvale is under water as is most of 101 and 237. On right side, we see what happens if we do everything possible to reduce GHG starting now. Major portions of north Sunnyvale are lost, but 101 is dry. In-between measures gets us in-between results. Click on image to enlarge:

Maps based on peer-reviewed scientific article available at above link - click on "Learn about this map" in upper right of map at that site.
Timing is not 100% certain, however most timing estimates have been conservative. Regrettably, all the surprises so far have been that it is getting worse faster than predicted. For example, the recent bleaching of the coral of the Great barrier Reef came 30 years earlier than expected.
Cf:
As for sea level rise, "In 2013, scientists reached a consensus that three feet was the highest plausible rise by the year 2100. But now six or seven feet [i.e., 2 meters]
"Scientists nearly double sea level rise projections for 2100, because of Antarctica"

Above is a screenshot of a short video found at:
In 3 short years, the scientific estimates for what the year 2100 holds have doubled. "Many climate scientists, including Dr. Dutton, believe a rise of at least 15 or 20 feet From NY Times:
It will occur as increasing flooding at high tides. Flooding during storms will get higher and more frequent, even during mild rain storms. All of this will occur very gradually so it will be hard to recall that it was ever different.
Annapolis, MD - Before Flooding

Annapolis, MD - After Flooding


https://www.nytimes.com/interactive/2016/09/04/science/global-warming-increases-nuisance-flooding.html
The mayor of South Miami is also a scientist.
And, as seen below, not just South Miami, but that entire South-Eastern part of Florida is a lost cause, even with only 2 degrees warming - seen on right side of image. (click image to enlarge).

http://choices.climatecentral.org/#7/27.951/-81.442?compare=temperatures&carbon-end-yr=2100&scenario-a=warming-4&scenario-b=warming-2
Sea level rise is accelerating so drawing a straight line from past increases seriously underestimates the speed with which things will change. Things are worsening not as 2, 3, 4 but 2, 4, 8. The standard arguments about global warming are handled very well at https://skepticalscience.com/. Their search bar works to find the arguments and their counter.
Above is a screenshot of a short video found at:
In 3 short years, the scientific estimates for what the year 2100 holds have doubled. "Many climate scientists, including Dr. Dutton, believe a rise of at least 15 or 20 feet From NY Times:
It will occur as increasing flooding at high tides. Flooding during storms will get higher and more frequent, even during mild rain storms. All of this will occur very gradually so it will be hard to recall that it was ever different.
Annapolis, MD - Before Flooding

Annapolis, MD - After Flooding

 |
| https://www.nytimes.com/interactive/2016/09/04/science/global-warming-increases-nuisance-flooding.html |
The mayor of South Miami is also a scientist.
And, as seen below, not just South Miami, but that entire South-Eastern part of Florida is a lost cause, even with only 2 degrees warming - seen on right side of image. (click image to enlarge).
 |
| http://choices.climatecentral.org/#7/27.951/-81.442?compare=temperatures&carbon-end-yr=2100&scenario-a=warming-4&scenario-b=warming-2 |
Sea level rise is accelerating so drawing a straight line from past increases seriously underestimates the speed with which things will change. Things are worsening not as 2, 3, 4 but 2, 4, 8. The standard arguments about global warming are handled very well at https://skepticalscience.com/. Their search bar works to find the arguments and their counter.
What Produces Sea Level Rise?
As the average temperature of the earth increases, various factors come in to raise the average sea level.
Up to 1 meter of sea level rise is due to the expansion of water as it heats up. Water decreases in volume from 0 deg. C to 4 deg. C and increases in volume as the water temperature increases above 4 deg. C.
An additional 2 meters in sea level rise is due to the melting of smaller glaciers around the world. This takes a while so it is only visible on a long time scale.

http://mymodernmet.com/us-geological-survey-repeat-photography-melting-glaciers/
The above shows the same location after 100 years of melting, but this has accelerated in the last few years as can be seen here:
Unexpected side-effects of this will occur as when a retreating glacier eliminated one river while adding water to another river. It also eliminated completely a large lake:
Before:

Before the Glacier Receded
Descriptions of the lake before the change:
"With over 400 square kilometers and 70 km length, lake Kluane is the largest such body of water within the western Canadian territory."
"The lake has a mean depth of 31 m (102 ft) and a maximum depth of 91 m (299 ft). The
After:

After the Glacier Receded
Also here:
The single biggest contributor in the future will be the melting of ice on Greenland and Antarctica. (Click on image below to enlarge)

Right Hand Picture is in July which is Antarctica's Winter
"Rising Seas in California"

The State of California has a periodic review of how climate change will affect the state. The latest (April 2017) scientific analysis of sea level rise called Rising Seas in California (RSiC - cover shown above) is available here:
Rising Seas in California Summary:
RSiC Pg 16: "Once marine-based ice is lost, the resulting global sea-level rise will last for thousands of years." We see the increase in temperature of the Arctic over the last 2,000 years below:

https://www2.ucar.edu/atmosnews/news/846/arctic-warming-overtakes-2000-years-natural-cooling
RSiC pg 17:
El Nino more frequent - adds 8-12 in. to sea level while in effect, King tides add to local sea levels, Storm Surge adds up to 3 feet above normal levels, Waves can go 4-5 feet above normal levels increasing erosion along Pacific coast and enhanced flooding inland.
A storm surge adds several feet to a normal high tide as seen below (click image to enlarge):
 https://en.wikipedia.org/wiki/Storm_surge
RSiC pg 18:
Below we see the chart of CO2-equivalents concentrations in the atmosphere. The red line is what happens if we continue as we have. The Green line is RCP 2.6 - best we could hope for (click image to enlarge).
 RCP 2.6 (lowest carbon emissions possible) "will be very challenging to achieve, and most simulations of such stringent targets require widespread deployment of nascent carbon-negative technologies, such as sustainable bioenergy coupled to carbon capture and storage, or direct air capture of CO2." In other words - forget that one, baby.
RSiC pg 25:
For the San Francisco Bay Area, RCP 8.5 gives about 0.5 ft by 2050, 2.5 ft by 2100. If Antarctic Ice figures into it, (H++ scenario) it's

Below maps show effect on SF Bay Area using the pink line (H++) above which is the effect of the Western Antarctic Ice Sheet melting: (click on maps to enlarge)
3 ft by 2050: (SFO airport is 2 ft above sea level now and will be under water by 2040)
 6 ft by 2075: Oakland airport is under water as are Foster City, Redwood Shores, East Palo Alto, much of Alameda, and parts of all cities on the SF Bay.

10 ft by 2100:

21 ft by 2150:

From:
RSiC pg 35: Chart below shows that estimates of how high seas will rise will go increases fairly rapidly. I.e., every time they look at it they think it will be worse than they thought 3 years earlier. The worst case scenario projected in 2006 was better than the best case scenario in 2009.

RSiC pg 37: The has interesting animation of

You can find that animation here:
https://walrus.wr.usgs.gov/coastal_processes/cosmos/sfbay/index.html
RSiC pp 65-66:
After describing how little is known about Antarctic Ice Sheet melting they note: "It is worth emphasizing that the threat of massive sea-level rise from Antarctica is not only supported by the recent ice-sheet modeling literature, but also from basic observations and fundamental physical principles." Below is a drawing from page 66 illustrating the many complex interactions that affect the Antarctic Ice Sheet (click to enlarge):

Financial Aspects
This is looked at by the US Federal home loan agency "Freddie Mac" here:
http://www.freddiemac.com/finance/report/20160426_lifes_a_beach.html
The financial aspects will be huge. When an area floods often enough, it will be impossible to get flood insurance. Without that, no bank will write a mortgage for that property. The properties will then lose all resale value since no one will be able to get a mortgage. Banks will have a lot of loans in default as owners just give the keys to the bank and walk away from their worthless homes and stores. It gets worse for FL because most of the state is built on porous limestone. Salt water from rising seas can and will infiltrate the limestone and contaminate the fresh water. Even parts of FL that are relatively dry and not turned into islands will have no fresh water.
"Failure of climate-change mitigation and adaptation" was listed by the World Economic Forum as the top threat to the World Economy in 2016 (click image below to enlarge):

As the average temperature of the earth increases, various factors come in to raise the average sea level.
Up to 1 meter of sea level rise is due to the expansion of water as it heats up. Water decreases in volume from 0 deg. C to 4 deg. C and increases in volume as the water temperature increases above 4 deg. C.
An additional 2 meters in sea level rise is due to the melting of smaller glaciers around the world. This takes a while so it is only visible on a long time scale.
 |
| http://mymodernmet.com/us-geological-survey-repeat-photography-melting-glaciers/ |
The above shows the same location after 100 years of melting, but this has accelerated in the last few years as can be seen here:
Unexpected side-effects of this will occur as when a retreating glacier eliminated one river while adding water to another river. It also eliminated completely a large lake:
Before:
 |
| Before the Glacier Receded |
"With over 400 square kilometers and 70 km length, lake Kluane is the largest such body of water within the western Canadian territory."
"The lake has a mean depth of 31 m (102 ft) and a maximum depth of 91 m (299 ft). The
After:
 |
| After the Glacier Receded |
Also here:
The single biggest contributor in the future will be the melting of ice on Greenland and Antarctica. (Click on image below to enlarge)
 |
| Right Hand Picture is in July which is Antarctica's Winter |
"Rising Seas in California"

The State of California has a periodic review of how climate change will affect the state. The latest (April 2017) scientific analysis of sea level rise called Rising Seas in California (RSiC - cover shown above) is available here:
Rising Seas in California Summary:
Rising Seas in California Summary:
RSiC Pg 16: "Once marine-based ice is lost, the resulting global sea-level rise will last for thousands of years." We see the increase in temperature of the Arctic over the last 2,000 years below:
 |
| https://www2.ucar.edu/atmosnews/news/846/arctic-warming-overtakes-2000-years-natural-cooling |
RSiC pg 17:
El Nino more frequent - adds 8-12 in. to sea level while in effect, King tides add to local sea levels, Storm Surge adds up to 3 feet above normal levels, Waves can go 4-5 feet above normal levels increasing erosion along Pacific coast and enhanced flooding inland.
A storm surge adds several feet to a normal high tide as seen below (click image to enlarge):
https://en.wikipedia.org/wiki/Storm_surge
A storm surge adds several feet to a normal high tide as seen below (click image to enlarge):

RSiC pg 18:
Below we see the chart of CO2-equivalents concentrations in the atmosphere. The red line is what happens if we continue as we have. The Green line is RCP 2.6 - best we could hope for (click image to enlarge).

RCP 2.6 (lowest carbon emissions possible) "will be very challenging to achieve, and most simulations of such stringent targets require widespread deployment of nascent carbon-negative technologies, such as sustainable bioenergy coupled to carbon capture and storage, or direct air capture of CO2." In other words - forget that one, baby.
RSiC pg 25:
For the San Francisco Bay Area, RCP 8.5 gives about 0.5 ft by 2050, 2.5 ft by 2100. If Antarctic Ice figures into it, (H++ scenario) it's

Below maps show effect on SF Bay Area using the pink line (H++) above which is the effect of the Western Antarctic Ice Sheet melting: (click on maps to enlarge)
3 ft by 2050: (SFO airport is 2 ft above sea level now and will be under water by 2040)

6 ft by 2075: Oakland airport is under water as are Foster City, Redwood Shores, East Palo Alto, much of Alameda, and parts of all cities on the SF Bay.

10 ft by 2100:

21 ft by 2150:

From:
RSiC pg 35: Chart below shows that estimates of how high seas will rise will go increases fairly rapidly. I.e., every time they look at it they think it will be worse than they thought 3 years earlier. The worst case scenario projected in 2006 was better than the best case scenario in 2009.

RSiC pg 37: The has interesting animation of

You can find that animation here:
https://walrus.wr.usgs.gov/coastal_processes/cosmos/sfbay/index.html
RSiC pp 65-66:
After describing how little is known about Antarctic Ice Sheet melting they note: "It is worth emphasizing that the threat of massive sea-level rise from Antarctica is not only supported by the recent ice-sheet modeling literature, but also from basic observations and fundamental physical principles." Below is a drawing from page 66 illustrating the many complex interactions that affect the Antarctic Ice Sheet (click to enlarge):

Financial Aspects
This is looked at by the US Federal home loan agency "Freddie Mac" here:
http://www.freddiemac.com/finance/report/20160426_lifes_a_beach.html
The financial aspects will be huge. When an area floods often enough, it will be impossible to get flood insurance. Without that, no bank will write a mortgage for that property. The properties will then lose all resale value since no one will be able to get a mortgage. Banks will have a lot of loans in default as owners just give the keys to the bank and walk away from their worthless homes and stores. It gets worse for FL because most of the state is built on porous limestone. Salt water from rising seas can and will infiltrate the limestone and contaminate the fresh water. Even parts of FL that are relatively dry and not turned into islands will have no fresh water.
The financial aspects will be huge. When an area floods often enough, it will be impossible to get flood insurance. Without that, no bank will write a mortgage for that property. The properties will then lose all resale value since no one will be able to get a mortgage. Banks will have a lot of loans in default as owners just give the keys to the bank and walk away from their worthless homes and stores. It gets worse for FL because most of the state is built on porous limestone. Salt water from rising seas can and will infiltrate the limestone and contaminate the fresh water. Even parts of FL that are relatively dry and not turned into islands will have no fresh water.
"Failure of climate-change mitigation and adaptation" was listed by the World Economic Forum as the top threat to the World Economy in 2016 (click image below to enlarge):

Bid Adieu to Mountain View
Mountain View levels locked in by 2100. NOTE: For the scenario below, as in the previous view of Sunnyvale, the right hand side assumes we take drastic measures to reduce GHGs starting now. Drastic measures will not stop that, they will simply ensure that things don't further deteriorate by 2100. By 2050, with no GHG reductions at all, things won't look too different from the right side. The worst effects take time to show up at around 2100 and beyond - when it will be too late.
 |
|
The difference we see above and in the earlier screen shot of Sunnyvale shows up 50 years later - locked in by 2100. Taking action now can stop the situation shown on the left side from happening. The right view scenario is baked in already. That train left the station and isn't coming back. (click image to enlarge)
 |
| Part of Palo Alto will disappear. This street above will be under water if we do not change. |
 Nevermore to Redwood Shores
The San Francisco and Oakland airports SFO and OAK are submerged in either GHG mitigation scenario - drastic GHG reduction or BAU (Business As Usual). SFO is only 2 ft above sea level. Neither airport can build sea walls to keep out the water because that would prevent planes from landing. Foster City and Redwood Shores are completely gone in either case, unless they build high (and expen$ive) sea walls, which they will - it is valuable property. San Mateo County and Foster City are looking at levee construction due to Federal Government flood insurance requirements. Since the effects of Global Warming will lasts thousands of years, it is not clear how long people will trust California's infrastructure maintenance. The homes may become rentals, get depreciated to zero and then removed, along with the levees.
Highways 101 and 880 will be under water partially or completely. Perhaps they will become elevated causeways. San Jose's airport will have a view of the Bay lapping at it's edge. The earlier maps were for 2100 and you could see a dramatic difference between the right and left sides. This difference locked in is not yet very pronounced by 2050 as seen below. (click on images to enlarge)
From: http://choices.climatecentral.org/#12/37.6305/-122.2732?compare=scenarios&carbon-end-yr=2050&scenario-a=unchecked&scenario-b=extreme-cuts
Highways 101 and 880 will be under water partially or completely. Perhaps they will become elevated causeways. San Jose's airport will have a view of the Bay lapping at it's edge. The earlier maps were for 2100 and you could see a dramatic difference between the right and left sides. This difference locked in is not yet very pronounced by 2050 as seen below. (click on images to enlarge)
SFO You're Gonna' Go
 |
| By 2050 Highways 101 and 880 are underwater as are SFO and OAK |
 |
| The Future of Highway 880 and 101? |
Redwood Shores - Water Covers All Walking/Driving Areas
 |
| One meter (3 feet) rise by 2100 predicted by 2013 IPCC. By 2016, scientists raised that to 2 meter (6.5 feet) rise. |
 |
| http://sealevel.climatecentral.org/uploads/research/Global-Mapping-Choices-Report.pdf |
SF Bay with 2 Meter Rise (2 Meter Rise Is Certain)
 |
| http://geology.com/sea-level-rise/san-francisco.shtml |
Highway 101 and thirteen other streets:
http://www.mercurynews.com/2017/02/22/flooding-shuts-down-stretch-of-highway-101-in-san-jose-other-road-closures-in-city/


"Caltrans officials said Tuesday morning they have closed at least eight highways due to storm-related damage."
http://abc7news.com/news/at-least-8-bay-area-highways-closed-due-to-flooding/1742177/
 |
| CA-12 Sonoma County |
http://kiem-tv.com/video/road-closures-across-humboldt-county
So. California as well:
http://ktla.com/2017/02/17/northbound-101-freeway-closed-near-ventura-as-mud-floods-roadway-chp/

Sea Level Rise will not happen uniformly or all at once. That is the Hollywood version which might convince some doubters but is NOT going to happen.
 |
| The Hollywood Version - Not going to happen |
Nuisance flooding will happen first - a minor flood every year. Then more often followed by better (and expensive) pumped drainage systems and sea walls giving the appearance of success against the sea rise. Finally, a storm happens when seas get a little higher than levees were built for (this is what happened in New Orleans in Katrina). The levees collapse with major flooding then disaster relief on the condition of no rebuilding. Less expensive commercial areas with car lots and older shopping plazas would be abandoned earlier as uninsurable and not worth saving.
"Nuisance" Flooding - Charleston South Carolina (2015)
 |
| Charleston SC, http://today.cofc.edu/2015/08/07/storm-surge/ |
Get a Memento of Sacramento
The biggest change will be in the central valley. The Business As Usual scenario (left side below) will end up losing a very large swath of agricultural land and much of Sacramento. This scenario will be locked in by 2100 under BAU. The right side with drastic GHG reduction starting now isn't pretty either, but at least most of old Sacramento is intact. Either way, Napa and Petaluma become sea ports. (click on image to enlarge).
Parts of N. CA Under Water
 |
| http://choices.climatecentral.org/#9/38.0794/-122.1185?compare=scenarios&carbon-end-yr=2100&scenario-a=unchecked&scenario-b=extreme-cuts |
The huge agricultural area of the Sacramento Delta is already prone to flooding. It will not be getting better. They have already built many levees there to contain the water "but when the levee breaks...". Look at the large levee below (note the truck in the upper right for scale) - that is a lot of rock and earth that just gave way without warning.

When the Levee breaks...

""...such an episode would affect drinking water for millions of people and agricultural animals, such as the state's huge dairy herd, as well as irrigation water for food crops and water supplies for industry. http://calag.ucanr.edu/Archive/?article=ca.v061n02p53
Well maintained, inspected the day it broke...

Of the failed levee above: "The district works year-round on the levees, fortifying them with rock sent by barge up the Delta.
From http://www.sfgate.com/bayarea/article/Deluge-in-the-Delta-It-was-like-an-ocean-2769458.php#photo-2198020
If we seal off the Carquinez Straits, that would prevent some ocean water from entering through there, but warmer air holds more moisture so rain will be heavier meaning much of the flooding will come from the Sacramento River. You can run but you can't hide - if the ocean don't get ya', the rivers will. Much more at http://sealevel.climatecentral.org/
Such a Pity About New York City
Wall Street and Broadway in Manhattan. Business As Usual (4 degree rise) first....

... compared to starting now with drastic GHG reduction (2 degree rise) below:


... compared to starting now with drastic GHG reduction (2 degree rise) below:

Even 2 degrees Celsius (6 meter sea level rise) dramatically affects Brooklyn and New Jersey. This level of rise is pretty much guaranteed to be locked in by now. As a constant daily water level it is not expected to happen until after 2100 but there will be more and more "nuisance" flooding that will make it harder and more expensive to get insurance. Ultimately much of the lower areas will be abandoned. Much of the flooded part of NJ is already dedicated to salt marshes. Brooklyn and Queens are heavily residential.
 |
| http://geology.com/sea-level-rise/new-york.shtml |
Part of Brooklyn, NY Subject to Flooding
Here is one intersection in Brooklyn.
 |
| Fourth Ave. and Carroll St. Brooklyn |
 |
| Fourth and Carroll St. - Brooklyn, NY - Dry |
 |
| Fourth and Carroll St. - Brooklyn, NY - Half a Meter Flooded
By 2100, a 2 meter sea level rise is virtually guaranteed around the world. On the east coast, above is Brooklyn, NY near Atlantic Ocean with only half a meter of water. Two meters of water covers bottom two thirds of the first floor and covers all the cars above their roofs in water.
Below is the map of NYC flooding areas for hurricanes. These areas will get flooded more and more often with milder and milder storms. Well before they are completely covered all the time, they will be flooding every "King" tide and they will be abandoned.
|

Boston, MA

It is hard to see how you can build a sea wall big enough to preserve much of Boston.
Shape of Things to Come?Heavy rains caused massive flooding in China in 2016 resulting in 1.3 Million people being evacuated. Below is a still screen capture from 8 Minute Movie of the flooding available on YouTube at https://www.youtube.com/watch?v=MTaoPv-O4DQ . I highly recommend the 8 minutes. It is very hard to get some of those video segments out of your mind. |
Finally: a three-and-a-half minute movie using Google Earth to give a flyover view of major cities under different scenarios. First it shows 4 degrees rise which implies giving up much of major cities. Then we see the results if we hold it to 2 degrees C which makes London almost manageable but NYC is still in deep trouble. Finally 1.5 degrees C which is quite manageable with good drainage, and some low sea walls, although NYC will still have a lot of work to do to stay viable in all parts of the city.
We are at 1.5 degrees C already and keeping it there is out of the question. Honestly, 2 degrees C is "aspirational" at this point. We are really looking at 2.6 degrees C if we pull out all the stops and go full on carbon free. More realistically, if we can keep it to 3 degrees C we are doing well.
So what should we do?
Every individual and organization is constrained by finances, but technology is moving ahead rapidly and costs are dropping very fast so it is no longer the case that being green costs money. Solar panels on new construction in California have a break-even payback point of about 11-12 years. Solar and wind power is now winning price competition around the world without subsidy in many (not all) countries. I cover a lot of the positive things happening in another blog here:http://meetingthetwain.blogspot.com/2017/06/the-future-of-energy-in-20-charts.html
Battery electric vehicles are expected to become widely cost-competitive with Internal Combustion Engines by around 2022, at the latest. For some applications such as shipping and air transport where batteries may not be feasible using current technology, renewable bio-fuels from sources such as algae are possible.
To replace oil and natural gas we will need about 3 times as much renewable electricity. Generating electricity where it is used is the most efficient and cheapest. More and more cities are mandating solar on all new construction. Building and maintaining transmission lines are nearly 50% of the average electric bill.
But there are ways in which the current economic structure acts against rational behavior. Putting solar on all new construction is much, much cheaper than waiting until after the building is finished. Builders don't do that because it raises the cost of construction which shows up in the rents they need to charge to pay off the bank loans for putting up the building. The company that builds the building is usually not the company that pays the electric bills. On the other side, the future tenant company that will pay the electric bill looks for rental space that is cheapest, not greenest. This is where government should be stepping in to resolve the contradiction by requiring solar panels and other green building.
The seas will rise because of what we have already done, but we can stop the worst from happening if government helps resolve the contradictions.