The End of Oil &
Rise of Electric Vehicles
"The stone age didn't end for lack of stones"
(Sheik Yamani - former Saudi Oil Minister)
 |
| https://www.wsj.com/articles/get-ready-for-peak-oil-demand-1495419061 Even the Wall St. Journal sees it coming! |
First - 1900:

Second - 1913:

Electric Vehicles (EVs) are to internal combustion engine (ICE) cars as motor cars were to horses.
The "Tesla Effect" is already starting to hit the price of oil cos. as long term investors get out of what are likely to be rapidly declining industries. One oil analyst explained this on CNBC in Oct. 2018 as seen below:
Growth of EVs on the roads
Tony Seba's point is that when change happens it can happen very, very fast. Electric vehicles (EVs), Seba argues, will replace internal combustion engines (ICEs) as fast as ICE's replaced horses - probably faster. "Faster" because switching from horses to ICEs required the construction of a massive number of gas stations, refineries, delivery systems, auto mechanic shops, and paved roads. Switching from ICEs to EVs requires electric outlets. We already have those.
Below is the International Energy Agency's chart of how fast EVs have been adopted around the world.
Seba's argument is that while world-wide EV sales represent only 1.34% of sales now, they have been doubling their sales every 2 years. (see chart below - click to enlarge):
If sales continue growing at that rate then in 2019 = 2.7%, 3.8% in 2020, 7.5% in 2022, 10.5% in 2023, etc., etc. putting the crossover year in 2030 - thirteen years from 2017 - the same time it took autos to replace horses! What a coincidence!
Or maybe it isn't a coincidence. There is a similar pattern to many technology adoptions as seen here (click on chart to expand):
The most rapid adoptions are happening most recently as seen from above chart. The telephone took 60 years to go from 5% to 80% of US households. Cell phones took 10 years to do the same (see chart above):
The International Monetary Fund (IMF) published a working paper in May 2017 titled "Riding the Energy Transition: Oil Beyond 2040".
https://www.imf.org/en/Publications/WP/Issues/2017/05/22/Riding-the-Energy-Transition-Oil-Beyond-2040-44932
From the paper: Electric Vehicle adoption is happening at a faster rate than cars were adopted. As a minor but supportive note, if you look closely you can make out that e-bikes are being adopted faster than were motorcycles (click image to enlarge).
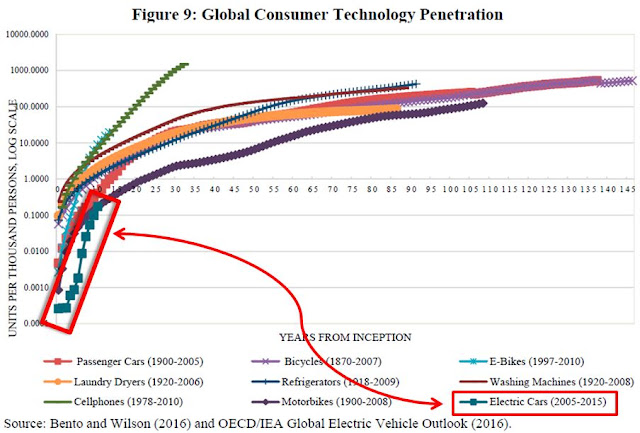
Same thing only clearer - red line (electric vehicles) growing at a faster rate from 2011 (at 0.07 per 1,000 people) than purple line (motor vehicles) - from 1900 (at 0.11 per thousand people):
As motor vehicles became more common, horses became less common - diminishing from 39 per 1,000 people in 1905 to 3 per 1,000 by 1930 as shown below (note logarithmic axis so growth is much faster than initially appears). Again, we see EVs growing faster than motor cars did. Will EVs replace motor cars faster than autos replaced horses?
As EVs gain market share, at some point it will become harder and harder to find gas stations and auto repair shops. The drive train for the standard motor car has about 2,000 moving parts - pistons, gears, belts, rotors, etc., etc. (see below).
EVs have less than 20. The drive train for an EV consists of batteries, one to four electric motors, brakes, steering wheel, battery coolant, seats and wheels. That's it - no crankshaft, transmission, gears, starter motor, pistons. See below:

The maintenance costs for motor cars are correspondingly more. Those owning motor cars will see themselves paying for oil changes, transmission maintenance, belt replacements, etc. while their neighbors with EVs do none of these. The costs of maintaining a motor car will make it increasingly obvious that the sooner one replaces a motor car with an EV, the sooner the financial drain will end.
We can see that in the following chart. As EV's market share goes to 100% the %-age of cars on the road that are still Internal Combustion Engine (ICE - burning gasoline) diminishes. Typically, cars have a useful life of about 20 years so 5% of ICEs will be scrapped every year once EVs are at 100% of new car sales. By the 2035 or so only 50% of cars on the road will be ICEs. There will be half as many refineries, half as many gas stations, half as many repair shops. The remaining ICEs will be scrapped a few years earlier than before EVs took over. ICEs could be completely gone before 2040.
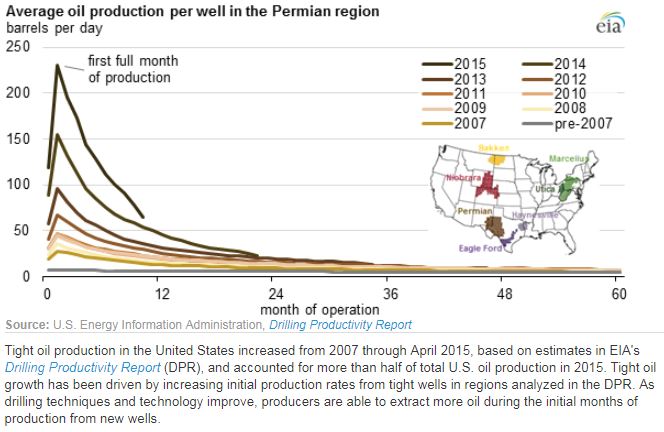
The same month the IMF paper was published saying that the "age of oil" was nearing an end, the Wall Street Journal, a conservative pro-business newspaper, reported essentially the same thing with the only issue in doubt being the timing. Part of that is production. While fracking of shale oil has produced spectacular new supplies, oil from these sources declines very rapidly as seen below:
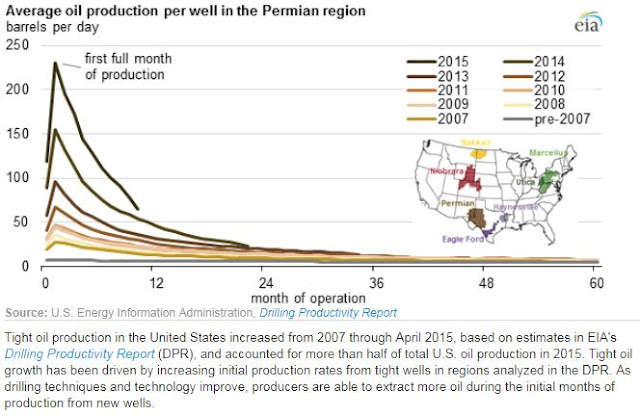
 Charts from US Energy Information Agency:
https://www.eia.gov/todayinenergy/detail.php?id=24932
Before getting into details, I want to note that "experts" have been spectacularly wrong about how fast new technologies are adopted. Seba's 13-year projection for 100% of all new cars being EVs was based on the incredibly rapid replacement of the horse with the motor car. That change in 1913 required enormous changes of infrastructure - massive numbers of oil refineries, gas stations, paved roads, mechanics and parts suppliers for maintenance. The EV needs an electrical outlet - we already have those.
Here are some views (as noted in the WSJ article):
 IEA: "The Paris-based International Energy Agency argues that demand [for oil] will grow, albeit slowly, past 2040" (WSJ, ibid) This is based on the assumption that countries won't do much to strengthen regulations to mitigate Green House Gas emissions (GHGe). If countries do impose restrictions on GHGe then the IEA predicts 2020 for peak oil demand.
 BP: British Petroleum predicts 2040, but alternative scenarios based on the rate of shift to alternative fuels are labeled "fast" and "faster" predicting earlier and much earlier times for peak oil demand. BP is shifting investment to natural gas. BP has a carbon-neutral project: https://www.bptargetneutral.com/us/
 Royal Dutch Shell: peak demand in 2025 to 2030. The CEO of Shell is getting an electric car. The CFO already has one. Shell is shifting investment to natural gas and renewables.
Statoil: peak oil demand in 2030. Norway's oil producing company sees a rapid shift to electric cars in both the developed and developing world (where gas is usually $6-$7 per gallon).
Total Oil Co: 2040. The French oil company uses the IEA scenarios.
Exxon, Aramco, Chevron: No peak oil demand in sight.
McKinsey Co.: 2035. EVs will represent 50% of the car market in developed countries and 30% in emerging economies. http://www.mckinsey.com/industries/oil-and-gas/our-insights/is-peak-oil-demand-in-sight
"...the biggest “X” factor is how widespread electric-vehicle (EV) adoption will be. Transport fuel accounts for about 50% of the demand for crude oil, with cars accounting for half of that..." (WSJ - ibid). As described in the WSJ article, the IEA's conservative estimate for 2040 hinges on the importance of trucking as a consumer of oil and the importance of mass market 200-mile range cars as a minimum requirement for widespread adoption.
But we already have several cars with over 200 miles of range before recharging. That 200 miles between recharging is almost universally considered the tipping point at which mass market sales of EVs will take off, along with a price of around $33,000 - the average selling price of new cars in the US.
In California, "When the Legislature returns in January, Assemblyman Phil Ting plans to introduce a bill that would ban the sale of new cars powered by internal-combustion engines after 2040."
http://www.sacbee.com/news/politics-government/capitol-alert/article176030626.html
Trucks and other transport (shipping, air, military) account for about 40% of transport oil demand, cars about 60% of transport oil demand. The IEA spokesman said that without trucking going electric he could not see a peak demand coming any sooner than 2040. Except electric trucks are already here:
A typical semi-truck costs $120,000 new, drives 100,000 miles per year and uses about $75,000 in diesel fuel annually. An electric truck pays for itself in 2-3 years based solely on the cost of fuel. Trucking companies are eager to electrify as they care about only one thing - lowest total cost.
Ford teamed up with DHL (Deutsche Post in the EU) to make delivery trucks. They come in 50-mile range and 124 mile range. They are sold to other trucking companies as well. Few delivery trucks go more than 75 miles but most do a lot of stop-and-go. That stop-and-go is very hard on ICEs. Since often the motor is left running while the delivery person runs out and back, it is also very expensive and hard on the environment. If an EV isn't moving the battery does nothing. Since delivery trucks have fixed routes (typically about 100 miles) it is easy to choose just the right amount of battery power.
Update 12/4/2017. Tesla revealed details on it's semi truck. It has a 500-mile range which covers about 80% of truck trips.
Truckers in the US are forbidden to drive more than 450 miles without a 30-minute rest. In the EU that is no more than 350 miles in a single stretch. The Tesla Semi takes care of the maximum distance allowed without a break for a truck driver. The truck can be recharged to a 400-mile range in 30 minutes during that mandatory break. Altogether that means up to 900 miles with only one 30 minute break.
More here: https://electrek.co/2017/11/17/tesla-semi-electric-truck-specs-cost/
Long distance hauling is mostly carried by rail these days as seen below. (click chart below to enlarge).
 http://www.greencarreports.com/news/1112322_tesla-semi-reportedly-has-200-to-300-miles-of-range
In Norway 42% of new car sales were electric in 2016. China is demanding all auto companies produce 8% electric cars, and will raise the requirement as time goes on. On bad air days in China, ONLY EVs are allowed in cities. China's auto market is the largest in the world at about 24 Million/year vs 17 Million/year in the US. Below is a 100% electric medium delivery truck. Thousands have been sold in China and it is being brought to the US in partnership with Ryder Truck Leasing. The CEO of Ryder is a former Tesla executive.
 There are 7 million trucks this size on the roads of the US. About 500,000 are sold each year.
(Related: The Netherlands govt. officially bans the sale of internal combustion engines for 2025 and requires all vehicles on the road to have zero emissions by 2030 - http://www.greencarreports.com/news/1113295_all-cars-with-engines-to-be-off-dutch-roads-by-2030-following-2025-sales-ban)
(Related post on renewable energy: http://meetingthetwain.blogspot.com/2017/06/the-future-of-energy-in-20-charts.html )
In terms of transportation, we are very close to a golden age of electric vehicles of all sizes and uses. Long term, we can stop using GHG emissions as a reason for biking, high density housing, and everything else under the sun. Biking, and high density housing must be considered on their own merits. Transport of goods and people is on the edge of a great sea change which will change the conversation about these issues dramatically. There will still be important areas to work on, but by 2030 it will be very clear that transport GHG emissions won't be one of them.
 |
| From IEA publication at: https://www.iea.org/publications/freepublications/publication/GlobalEVOutlook2017.pdf |
 |
Worldwide EV Market share 0.83% in 2016 to 1.34% in 2017 to 1.95% in 2018
|
 |
| If EVs continue to double market share every two years (= 41% per year) https://cleantechnica.com/2018/07/01/please-stop-saying-evs-are-only-1-of-auto-sales-in-the-us/ |
 |
| Market penetration rate of new technologies increases over time |
The most rapid adoptions are happening most recently as seen from above chart. The telephone took 60 years to go from 5% to 80% of US households. Cell phones took 10 years to do the same (see chart above):
The International Monetary Fund (IMF) published a working paper in May 2017 titled "Riding the Energy Transition: Oil Beyond 2040".
https://www.imf.org/en/Publications/WP/Issues/2017/05/22/Riding-the-Energy-Transition-Oil-Beyond-2040-44932
From the paper: Electric Vehicle adoption is happening at a faster rate than cars were adopted. As a minor but supportive note, if you look closely you can make out that e-bikes are being adopted faster than were motorcycles (click image to enlarge).

Same thing only clearer - red line (electric vehicles) growing at a faster rate from 2011 (at 0.07 per 1,000 people) than purple line (motor vehicles) - from 1900 (at 0.11 per thousand people):
 |
| IMF Working Paper No. 17/20 https://papers.ssrn.com/sol3/papers.cfm?abstract_id=2978681 |
 |
| IMF Working Paper No. 17/20 https://papers.ssrn.com/sol3/papers.cfm?abstract_id=2978681 |
Internal Combustion Engine Car
20,000 Moving Parts
 |
| All the parts of an Internal Combustion Engine (ICE) car. Over 99% disappear in an Electric Vehicle. |
Internal Combustion Engine Car
20 Moving Parts

We can see that in the following chart. As EV's market share goes to 100% the %-age of cars on the road that are still Internal Combustion Engine (ICE - burning gasoline) diminishes. Typically, cars have a useful life of about 20 years so 5% of ICEs will be scrapped every year once EVs are at 100% of new car sales. By the 2035 or so only 50% of cars on the road will be ICEs. There will be half as many refineries, half as many gas stations, half as many repair shops. The remaining ICEs will be scrapped a few years earlier than before EVs took over. ICEs could be completely gone before 2040.
Electric Vehicle Market Share - Red line
Internal Combustion Engine Vehicles on the Road - Green Line
 |
| ICEs dying out - Green line Replaced by EVs - Red line |
When Will Oil End?
The effect on Green House Gas emissions of drastically reducing oil demands is enormous (46% of US GHGe are from petroleum) as seen below: |
| https://www.eia.gov/todayinenergy/detail.php?id=36953 |
Most of that oil is used in transportation as seen below:
Most Petroleum Products Used in Transport
 |
| https://www.eia.gov/todayinenergy/detail.php?id=36953 |

https://www.eia.gov/todayinenergy/detail.php?id=24932
Before getting into details, I want to note that "experts" have been spectacularly wrong about how fast new technologies are adopted. Seba's 13-year projection for 100% of all new cars being EVs was based on the incredibly rapid replacement of the horse with the motor car. That change in 1913 required enormous changes of infrastructure - massive numbers of oil refineries, gas stations, paved roads, mechanics and parts suppliers for maintenance. The EV needs an electrical outlet - we already have those.
When Will Peak Oil Demand Happen?

 BP: British Petroleum predicts 2040, but alternative scenarios based on the rate of shift to alternative fuels are labeled "fast" and "faster" predicting earlier and much earlier times for peak oil demand. BP is shifting investment to natural gas. BP has a carbon-neutral project: https://www.bptargetneutral.com/us/
Statoil: peak oil demand in 2030. Norway's oil producing company sees a rapid shift to electric cars in both the developed and developing world (where gas is usually $6-$7 per gallon).
Total Oil Co: 2040. The French oil company uses the IEA scenarios.
Exxon, Aramco, Chevron: No peak oil demand in sight.
McKinsey Co.: 2035. EVs will represent 50% of the car market in developed countries and 30% in emerging economies. http://www.mckinsey.com/industries/oil-and-gas/our-insights/is-peak-oil-demand-in-sight
"...the biggest “X” factor is how widespread electric-vehicle (EV) adoption will be. Transport fuel accounts for about 50% of the demand for crude oil, with cars accounting for half of that..." (WSJ - ibid). As described in the WSJ article, the IEA's conservative estimate for 2040 hinges on the importance of trucking as a consumer of oil and the importance of mass market 200-mile range cars as a minimum requirement for widespread adoption.
But we already have several cars with over 200 miles of range before recharging. That 200 miles between recharging is almost universally considered the tipping point at which mass market sales of EVs will take off, along with a price of around $33,000 - the average selling price of new cars in the US.
 |
| Tesla Model 3 released July 2017 210 to 310 miles per charge $35,000 before $7,500 US tax rebate |
 |
| Chevrolet Bolt released December 2016 238 miles per charge $35,000 before $7,500 US tax rebate |
http://www.sacbee.com/news/politics-government/capitol-alert/article176030626.html
Trucks
Trucks and other transport (shipping, air, military) account for about 40% of transport oil demand, cars about 60% of transport oil demand. The IEA spokesman said that without trucking going electric he could not see a peak demand coming any sooner than 2040. Except electric trucks are already here:
 |
| Daimler Urban-e Truck - 124 mile range, shipping for trials late 2017 http://www.greencarreports.com/news/1108966_daimler-to-build-large-electric-semi-truck-urban-e-truck-results-good-so-far |
 |
| Cummins e-Truck AEOS https://www.engadget.com/2017/08/29/cummins-electric-semi-truck/ |
 |
| DHL (Deutsche Post in the EU) designed its own 100% electric trucks https://cleantechnica.com/2017/08/16/ford-teams-dhl-manufacture-electric-trucks-germany/ |
Update 12/4/2017. Tesla revealed details on it's semi truck. It has a 500-mile range which covers about 80% of truck trips.
 |
| 80,000 lbs carrying capacity, 500 mile range. Recharge to 400 mile range in 30 minutes Able to go uphill at full speed. No Gears to shift |
More here: https://electrek.co/2017/11/17/tesla-semi-electric-truck-specs-cost/
Long distance hauling is mostly carried by rail these days as seen below. (click chart below to enlarge).

The Future...

(Related: The Netherlands govt. officially bans the sale of internal combustion engines for 2025 and requires all vehicles on the road to have zero emissions by 2030 - http://www.greencarreports.com/news/1113295_all-cars-with-engines-to-be-off-dutch-roads-by-2030-following-2025-sales-ban)
Conclusion
In terms of transportation, we are very close to a golden age of electric vehicles of all sizes and uses. Long term, we can stop using GHG emissions as a reason for biking, high density housing, and everything else under the sun. Biking, and high density housing must be considered on their own merits. Transport of goods and people is on the edge of a great sea change which will change the conversation about these issues dramatically. There will still be important areas to work on, but by 2030 it will be very clear that transport GHG emissions won't be one of them.