Perma-link: http://meetingthetwain.blogspot.com/2017/06/the-future-of-energy-in-20-charts.html
Making Progress!
I offer the following 'uplifting' view of renewable energy as a counterpoint to the somewhat discouraging view of Sea Level Rise in "Bye-Bye Shanghai" at:http://meetingthetwain.blogspot.com/2017/04/bye-bye-shanghai.html
US Wind + Solar Hit 10% of total Production!

Iowa, Kansas, and Oooooklahoma lead US with 25% or more electricity from Renewable Energy (RE)! If Iowa can hit 37% wind power so can Texas, Kansas, and many others.

Both charts from: https://www.eia.gov/todayinenergy/detail.php?id=31632
Utility Solar growing fast!
First because it was mandated, but now 'cuz it's cheap!
Above from: https://www.eia.gov/todayinenergy/detail.php?id=31072#tab1
California's solar takes a big bite out of mid-day energy imports lowering the cost of electricity below zero! "...almost 40% of net grid power produced during the hours of 11:00 a.m. to 2:00 p.m"

More electricity storage will smooth out the early evening peak usage and lower prices at that time.
Above from: https://www.eia.gov/todayinenergy/detail.php?id=30692
US wind more than doubles!
... net electricity generation in US in 5 years! Now 5% of electricity generation.

Wind passes hydro-power!
Note the incredible rate of growth of wind power! From about 8,000 Mega Watts to over 80,000 MW in about 11 years. Now = 5% of total electricity. If wind does that again, it will be 50% by 2026.

As many have noted, wind power fluctuates a lot during the year, but so does hydro, and so does demand from Winter to Summer. And if you compare the wind generation chart above with the solar generation plot earlier, you note that wind is lowest (Summer) at the time when Solar is highest and vice versa. Wind and solar complement each other well.
Above from: https://www.eia.gov/todayinenergy/detail.php?id=30212
First time ever US GHGs from transport are now more than GHGs from electric power generation! Because coal is being replaced by natural gas which generates about 50% the GHG emissions of coal.
Where is the "good wind" in the US? The map below shows the best wind (dark blue, red, and purple) is in the Great Plains, the Great Lakes, and in the waters off both the North-East Coast and the entire West Coast. The Great Lakes alone could power the entire Mid-West.

Coal is declining fast!
The transport sector is not yet feeling the impact of electric vehicles. It will soon.
(Distillate Fuel means diesel oil for trucking and home heating.)

https://www.eia.gov/todayinenergy/detail.php?id=29612
Coal close to 1908 levels! Transport and Natural gas are next to go.

Incredible growth of Solar Power!
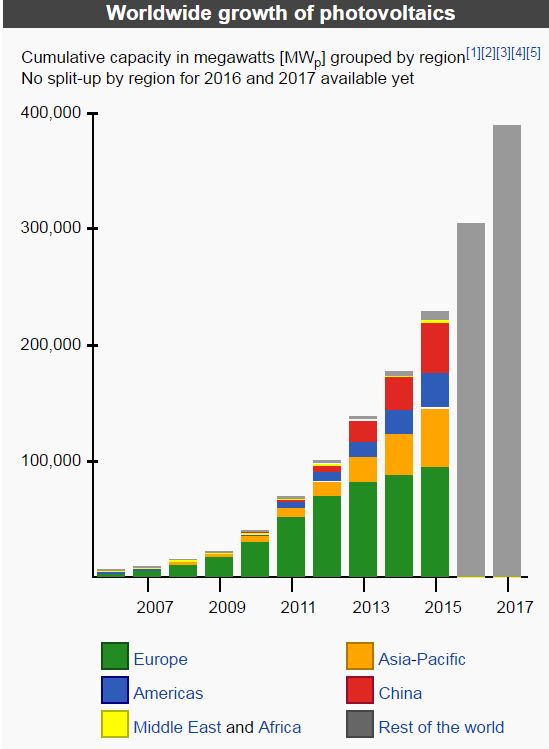

But solar represents barely over 1% of total world electricity production. We can't be complacent. The easy ones go fast. Resistance grows stronger. Efforts must be increased to continue the march of progress.
Above chart and table from: https://en.wikipedia.org/wiki/Growth_of_photovoltaics
Hyuuge Potential in US!
The little red empty circle on the lower right is what we use now in the US.

http://www.huffingtonpost.com/rob-sargent/100-percent-renewable-energy_b_9567486.html
The End of Oil Begins in 2022!
"The Stone Age didn't end because they ran out of stones. The oil age won't end because we run out of oil"
Sheik Ahmed Zaki Yamani, former Saudi oil minister


A Bloomberg New Energy article (whence came the last 3 charts) addresses many concerns about the possibility of electric vehicles (EVs) and find that there are no serious limits. The projected growth of EVs would use only about 1% of the known reserves of Lithium, and about 4% of the world's reserves of Cobalt. More here: https://www.bloomberg.com/features/2016-ev-oil-crisis/
The most "authoritative" predictions of the growth of green energy by "very serious people" have been ludicrously pessimistic. Below we see the real annual increase in Solar Panels (PV = Photo Voltaic) vs. the International Energy Agency's annual World Energy Outlook predictions.

Nothing can stop an idea whose time has come!
