First of all, buses are not particularly efficient on average. While they are very efficient per passenger mile, during rush hour, they are mostly empty during non-rush hours. As of 2020, they average about 25 miles per gallon of fuel per passenger mile vs. cars at around 40 MPG per passenger mile as seen below:

As of May, 2020 - Source: https://afdc.energy.gov/data/10311
Nor are buses cheap. "Fare recovery" varies a lot - for Valley Transportation Agency (VTA) in Santa Clara County it is 7% which means for every $2 they receive from fares, another $26 comes from taxes - see pie chart below:

Graph from page 47 VTA annual budget at: https://www.vta.org/sites/default/files/2019-10/Biennial%20Budget%20FY2020%20and%20FY2021.pdf
Outside of New York City, public transit struggles to gain market share of commuting as seen below.
 |
| San Jose (upper right inset box) has 4% commuting by public transit. San Francisco 33% From: https://en.wikipedia.org/wiki/List_of_U.S._cities_with_high_transit_ridership |
Speaking personally, I am generally for public transit. I am most definitely against GHG emissions. I think Climate Change is an extremely serious problem - far more serious than most people believe - and it is caused by burning fossil fuels. Nonetheless, we can't solve problems in these and other areas if we refuse to face facts or try to kid ourselves that human behavior will change to suit our preferences.
Summary:
- Bus and light rail ridership in Silicon Valley get only about 7% of their expenses from fares.
- Ridership on bus and light rail is declining locally and nationwide.
- People are driving more.
- Self-driving (autonomous) vehicles cannot be relied upon to solve traffic or land-use problems.
- Millennials are moving to the suburbs and buying SUVs.
The implications of Silicon Valley's VTA (valley Transit Authority) 7% Farebox recovery need to be emphasized. The remaining 93% of costs are dependent on taxes which do not change if ridership changes. That means that even if ridership on VTA doubled the increase in revenues would only be an additional 7%. This would allow a route with 20 buses a day to have 22 buses a day. Barely noticeable.
There is no more money available for public transit so low fare recovery means buses are not viable in most US cities. Even if public subsidies for buses were doubled, it would at best add another 4% to the current 4% of Silicon Valley commuters. 8% taking public transit (up from the current 4%) doesn't do much.
An idea circulated that if density increases in an area it would result in more buses being run to accommodate the increased potential ridership. This is false. Since 91% of bus costs are subsidized, running more routes in one place does not generate more revenue but instead costs even more money. Since there is no tax money currently available to expand routes, more buses running in one area means fewer buses running in another area.
Farebox Recovery
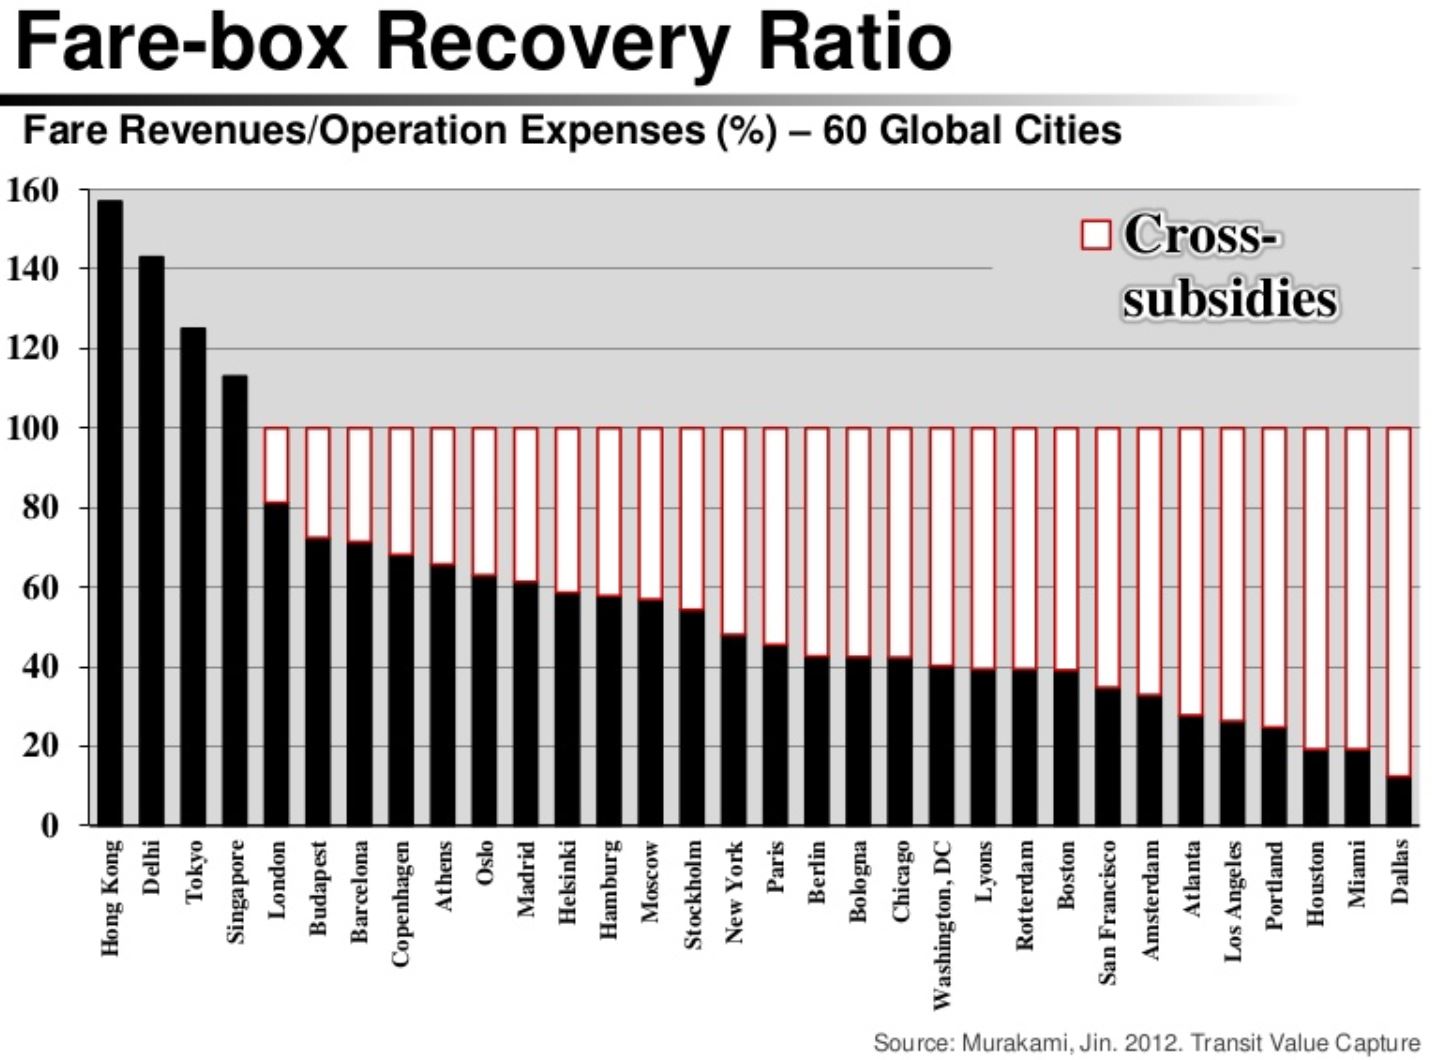
The following chart shows that only a few public transit systems worldwide do not need subsidies. Most get less than 50% fare recovery. (Click on chart to enlarge)
Public Transit Needs Subsidies
 |
| https://www.slideshare.net/EMBARQNetwork/financing-transitoriented-development-with-land-values-hiroaki-suzuki-lecturer-university-of-tokyo-transforming-transportation-2015 |
As can be seen above, the city of San Francisco overall is under 40% "fare recovery" meaning that for every $10 in costs, less than $4 is paid by riders - more than $6 is paid by taxpayers (who may be riders). This is a little better than Amsterdam and a little worse than Boston. (click graph to enlarge). NY City is the best in the US at 50% fare recovery. As shown below, fare recovery for VTA (Santa Clara County's bus and light rail system) is slightly under 9%.
The only four systems that do not require subsidies are Hong Kong, extremely densely populated, Tokyo, very spread out (making driving unappealing) as well as densely populated, or like Delhi poor (so few riders have an alternative) and dense and spread out. New York City has the highest fare-box recovery in the US at around 50% (between Paris and Stockholm) - it is also the most densely populated city in the US.
In much of the world, local buses are a way to avoid congestion in narrow streets of cities that grew up over 1,000 years or more. Subsidies to public transit are a way of avoiding other unacceptable or impossible street changes.
Widen Streets to Allow More Traffic?

In poorer countries, public transit is a necessity for people who otherwise could not get to work as they can't afford a car. Cities could not function in poor countries without public transit.
Can't Afford a Car - Take a Bus

The following chart shows bike-share programs in green, public transit in light blue. (click on graph to enlarge).
Public Transit (Even Bikes) Need Subsidies
 |
| LA's Bike Share Program Shown in Orange |
http://la.streetsblog.org/wp-content/uploads/sites/2/2015/11/MetroBikeShareStaffReport.pdf
VTA has one of the lowest fare recovery of any major population center in the world. Only $36M comes in from fares, to pay for part of the $413M expenses - a fare recovery of about 9% - see graphic from the VTA annual report below (click graphic to enlarge):

SamTrans and AC transit info from: http://www.samtrans.com/Assets/SamTrans+Fact+Sheet.pdf and http://www.actransit.org/about-us/facts-and-figures/budget/
In the case of VTA, the reduced fare recovery is due to decreased ridership. From the 2016 VTA Annual Report:
"... public transit agencies throughout the country experienced declining ridership in 2016. VTA experienced an overall decrease in ridership of 8.9%. The decrease is attributed to several external factors including weather, construction, low gas prices and private ride sharing services and corporate shuttles." I.e., corporate shuttles like Google's and Apple's are taking away business from public buses.
Google Shuttle Replacing Public Transit
 |
| Google Inc. employees board a bus that will take them to the company's campus, in Mountain View, from San Francisco http://www.sfchronicle.com/opinion/editorials/article/Google-bus-battle-ends-with-a-fine-solution-10952378.php |
Private Shuttles Bypassing Public Transit

"According to a 2016 Shuttle Census ...ridership on private and public shuttles in the Bay Area increased by 45% from 2012-2014 to a total of 9.6 million passengers in 2014." (VTA FY1819 Budget, ibid) The effects are seen in the following graph from the VTA budget report:
Bus Ridership Down - County Employment Up

This is broken out in the following two charts for weekly boardings showing bus and light rail. Note that Fiscal Year 2019 ended June 30, 2019, so these charts reflect a 12-month period for 2019. Clearly, bus ridership is dropping, and light rail ridership is dropping even faster. Both are at their lowest point in 10 years:
Ridership: Buses Down, Light Rail Waaay Down

| http://www.samtrans.com/Assets/_Finance/CAFR/ST/SAMTR+CAFR+2018.PDF page 71 |
| https://sf.streetsblog.org/2013/08/22/more-reliable-samtrans-ecr-bus-replaces-390-and-391/ |
VTA's fare recovery is one of the lowest of "peer agencies" according to VTA (thick red line on bottom of graph) as seen below:
Fare Recovery Rising/Flat In Peer Agencies - Falling for VTA
 |
| From: http://www.vta.org/News-and-Media/Connect-with-VTA/VTAs-Next-Network-Project#.WbyyCevyuUk |
One comment to that VTA blog post may reflect some of the reasons for the downward trends:
"I rode a VTA bus and walked A LOT from 1997 to 2004. There were countless number of times that the #23 did not show up or was very late. I was also a late evening rider who wonder if I would make it home, even on the #22 that ran all night. I was so happy to buy a car in 2004. That was because of poor connections between VTA buses, no show buses, and wondering how I would get home on weekends when I when 15 miles from home."
On Time Performance is shown in the charts below from VTA's Budget for FY 2018-2019, pg 113. In FY 2017, buses were on time about 86% of the time (up a little), light rail about 84% (up from 77% prior two years). (Click graph to enlarge)

You can't always easily get where you want to go by bus. Commuting between two locations in NYC illustrate this. 20 miles by Car takes 40 minutes to 1 hour 5 minutes. By bus takes 1 hour 34 minutes. Both the following maps are for 8 AM on a Monday. The first one shows the bus routes. Three buses needed = two transfers with a total time of 1 hour and 34 minutes minimum. This clearly illustrates that public transit in NYC requires going to the Central Business District (CBD) first since that is where the most usage is and buses need to go where most people want to go in order to get any economies of scale.
Brooklyn to Queens by Way of Manhattan
 |
| 20 miles = 3 Buses = 1 hour 34 minutes |
The second one shows driving between the same destination. Depending on traffic and route it can take 40 minutes to 1 hour and 5 minutes. Even in the worst case it is faster to drive. The 20 mile route is too far for biking (for most people) which at 10 miles per hour average would take two hours.
Brooklyn to Queens by Car
 |
| 20 miles in 40 minutes to 1 hour 5 minutes |
Sunnyvale to Mountain View By Bus
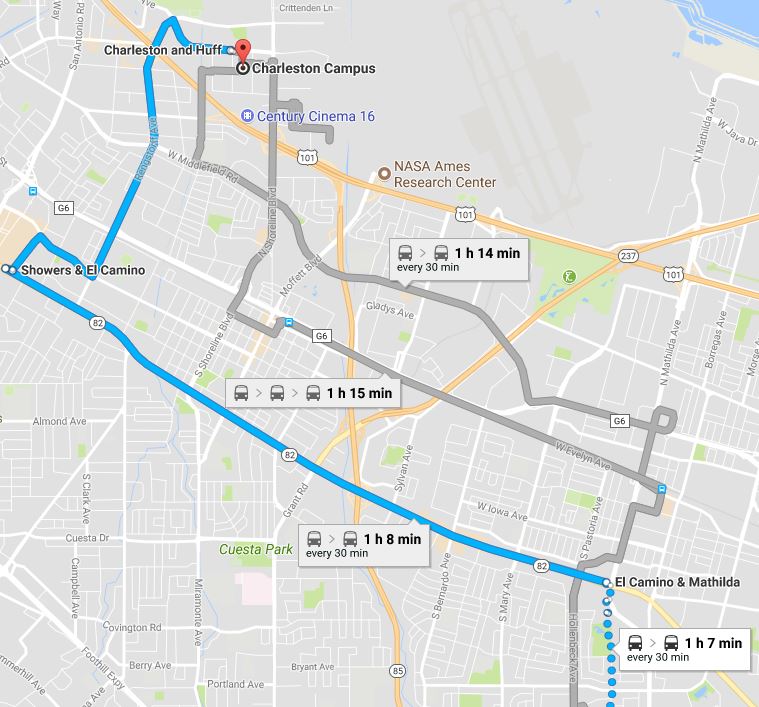 |
| Minimum time is 1 hour 7 minutes by bus |
Sunnyvale to Mountain View By Car
 |
| Minimum time is 27 minutes with lots of traffic in Red and Yellow (traffic delays) |
BART Ridership Rises with Employment
BART is doing better. BART ridership has generally risen and fallen along with employment in the SF Bay area as seen below.

https://timelines.issarice.com/wiki/Timeline_of_Bay_Area_Rapid_Transit
This rise in BART (heavy rail) and decline in buses is not unique to the SF Bay area. Exactly the same thing is happening in NYC as seen in the following chart from a NYC Transit Authority blog:
NYC Ridership - Subways Up - Buses Down

This continues a trend since the end of WW-II when the post-war economic boom enabled everyone to buy a car. Public transit declined significantly overall, particularly light rail, but heavy rail pretty much held steady as seen below - green is light rail, blue is bus, red is heavy rail (click graph to enlarge).
1917 to 2010 Transit Ridership Per Capita
 |
| http://kjzhang.freehostia.com/BSUD_introduction.html |
NYC Commutes - Cars 61%, Mass Transit 27%
 |
| http://www.newgeography.com/content/004967-commuting-new-york |
Autonomous (Self-Driving) Vehicles
There is now the hope (expectation?) that Autonomous Vehicles (AVs) will mean the end of individual car ownership. This is all to the good as safety will be greatly improved. Another hoped for possibility arising from this is driver-less taxis. Since the driver is the most expensive part of Uber-Lyft type of taxi service this should lower expenses so that no one needs a car. Everyone will (supposedly) hail a very inexpensive self-driving vehicle and forget the expenses and hassles of individual car ownership. This is called Cars as a Service (CaaS). That supposedly will free up incredible amounts of space and funds for nicer things than parking lots.Maybe. Peak usage at rush hour requires a lot of cars and the costs of those cars have to be recovered over the entire day. The question is what density of population do you need to keep overall costs at an acceptable level? We won't know until we try, but Lyft has announced suspension of their car-pooling outside of San Francisco: https://www.engadget.com/2016/08/22/lyft-suspends-bay-area-carpool/
In dense cities there are lots of people going lots of places throughout the day. Distances to destinations aren't very far within the city. Lots of riders all day long lowers the per person cost of those vehicles. A car dropping off a passenger at one place doesn't have to wait very long or go very far to pick up another passenger. Service should be quick and low cost.
Where Cars-as-a-Service Will Work
 |
| NY City |
In farming areas there are hardly any people so a car-less society won't work there. No rush hour to deal with and long distances between destinations mean Cars-as-a-Service will be neither quick nor low cost.
Where Cars-as-a-Service Will NOT Work.

In between - suburbs and smaller cities? Who knows? We can guess that CaaS will work in denser suburbs but not as well (i.e., more costly) in less dense suburbs.
Cars-as-a-Service Might Work(?)

Also, we really don't know when Autonomous Vehicles will be available. We see all sorts of estimates typically between 2020 to 2032 (http://www.driverless-future.com/?page_id=384) but some predict not until 2050 http://www.newsweek.com/you-may-not-live-long-enough-ride-driverless-car-575305. It would be best to wait until we have them before we start redesigning our cities around the belief they will be here "real soon now".
One possibility is that AVs will eliminate bus drivers. In FY 2017, out of a $426M total expenses, VTA spent $307M (72%) on labor (pg 51 & 54, VTA FY1819 Budget). Not all employees are bus drivers but Electric Vehicles (EVs) also require far less maintenance so maintenance staff will be smaller. A large part of the costs of public transit would disappear with AVs which are also EVs.
The end of buses? Certainly the end of big bulky buses on fixed routes. Even if buses survive they will have dynamic routes driven by demand. Buses the size of mini-vans might come to passengers in on-demand car-pooling instead of people needing to find a bus stop and wait for a scheduled time.
We don't know how much of an impact CaaS will have. If people were purely rational about costs of transport certain car makers wouldn't exist. We can't assume everyone is solely concerned with lowest cost.
 |
| Replace me with ride sharing? |
People Driving Less?
In 2011, a Public Interest Research Group study suggested people were driving less but "[the] study examined multiple variables—population density, median household income, frequency of working from home—and found only a rough correlation between more urban populations and lower VMT."Nationwide, urban residents drive about 9,930 miles per year, while rural residents drive an average of 14,850 miles." California's VMT/person is a little lower than average but not by much. See chart below from: http://ecowest.org/2013/10/01/americans-are-driving-less-the-state-by-state-story/

We should also look at fuel economy per passenger mile since that equates very closely with GHG emissions (click to enlarge):
 |
| https://www.afdc.energy.gov/data/10311 |
What we see above is that transit buses are one of the most inefficient users of fuel at effectively 32 miles per gallon per passenger. This is less than light trucks and cars. The reason is that while buses may be packed at rush hour, people won't take them at rush hour unless they know the buses are also available at off hours. So most of the time, buses are running at 25% of their capacity or less. cars are often single passenger but they also take kids and entire families places so miles per passenger are better.
Buses are essential to provide transport to many people who for excellent reasons don't drive cars. They are important to ease congestion during rush hour. The subsidies provided them are necessary for those and other reasons. But buses shouldn't be romanticized as the one big solution to any problem. They are just one part of a transport complex with good points and not so good points.
Millennials Are Just Like You and Me!

Vehicle Miles Traveled Rises to New Record
VMT per Capita Near Previous Record
 |
| http://www.ssti.us/2017/05/vmt-growth-continued-slowed-in-2016/ |
 |
| http://cdn1.blog-media.zillowstatic.com/3/PRINT_CHTR-2016_Final-10-13-a041f7.pdf |
"Generationally speaking, the stereotype of millennials as urbanites falls flat when it comes to home-ownership. The Zillow 2016 Consumer Housing Trends Report found that 47 percent of millennial homeowners live in the suburbs, with 33 percent settling in an urban setting and 20 percent opting for a rural area". That means only 1 out of 3 millennial homeowners prefer cities. That happens to be NYC's proportion. Out of 24 million people in the NYC consolidated statistical metropolitan area 8M live in NYC proper, 16M live in the suburbs. I.e., 33% live in NYC proper, and 67% live in the suburbs.
 |
| Numbers add to more than 100% because several options are looked for. |
Things have changed. "Erich Merkle, an economist with Ford, says that as millennials cross the threshold into family life, they're buying large SUVs."
Millennial Families Like SUVs
 |
From:
http://www.msn.com/en-us/money/companies/millennials-set-sights-on-larger-suvs/ar-AArlJdb
and from: http://www.npr.org/2017/09/15/551232392/as-millennials-get-older-many-are-buying-suvs-to-drive-to-their-suburban-homes
Conclusion
No one knows the future but it is a pretty good bet that human behavior will not change and that technology will change. We need to focus on the aspects we know we can change. Buses are necessary for many people and are deserving of support but they are not the solution for many people. They most definitely do not solve GHG emission problems.
 |
| Chevy Bolt - 238 Miles (EPA) on a Charge - Since December, 2016 |
Electric cars and trucks will be needed to remove GHG emissions from transport. They are here now and getting cheaper with longer range every year. More models are being announced by more auto companies monthly. (c.f., http://meetingthetwain.blogspot.com/2017/08/end-of-oil.html ).
 |
| Proterra 100% Electric Bus - 1101.2 miles on a single charge https://cleantechnica.com/2017/09/19/proterra-lg-announce-new-battery-cell/ |
To generate the electricity needed to replace all the oil currently burned we will need a lot more electricity. Solar panels on all new construction would put the solution on those who cause the problem.
Hoping for a change in human behavior can lead to inaction on real possibilities for real change. At a critical period in the fight against global warming we can't succumb to wishful thinking.
Addendum:
For all VTA budgets for the last 10 years go to: