Search This Blog

Wednesday, August 18, 2021

Manhattan, NY Commute Flows

Manhattan, NYC


New York City is the city Americans think about when they compare city life with suburban or rural life.

And, when people advocate for high-density living, public transit, and against suburban "sprawl" they usually use NYC as their model, for better or worse.

Permalink to this post for sharing:

Manhattan Subway

And, when they think of NYC, they are usually thinking of Manhattan - one of the five boroughs that make up NYC.  The borough of Manhattan (New York County) is 24 square (land) miles of tall buildings that is the original New York City (the other four boroughs were added over time until 1898).

Those advocating for density often cite NYC (Manhattan really) as the model to be emulated.  Much of what they think about NYC isn't true, particularly commuting.  Lets look at the numbers.

Commute Flows

Summary:

Manhattan, with only 24 square miles of NYC's 305 sq. miles, is the job center for the NYC metro area.  With over 2.3 million jobs and only 734,000 resident workers, Manhattan has more than 4.5 jobs for every resident worker.  Nearly 80% (77.8%) of those who work in Manhattan commute in from other areas.

One would think that nearly all residents could find a job they like within an easy commute by walking, bus, or biking.    But, in fact, nearly 30% (29.7%) of those who live in Manhattan (one of the most expensive places in North America) commute out of it to work in places which are almost always cheaper to live in than Manhattan.

Looking at the changes over the 16 years from 2002 to 2018, we see an increase in commuters.  There is an increase in both the number and percentage of those who live in Manhattan commuting out.  Not only that, they are commuting from Manhattan further and further out.  It is a slow, steady increase.

Nonetheless, as of 2018, only 15% of Manhattan residents commute more than 10 miles from home, although that is slowly but steadily increasing.

Commute Flows:

From the US Census Tool "OnTheMap" we have the commute flows of Manhattan in the first image below.  This shows that 1.8M workers commuted into Manhattan, while 217,911 living in Manhattan commuted out, and 515,641 of those living in Manhattan worked there.

Figure 1 - Commute Flows 2018
(click to enlarge)

In Figure 2, below, we have the commute flows of Manhattan in 2002, 16 years earlier.  This shows that 1.4M workers commuted into Manhattan, while 146,013 living in Manhattan commuted out, and 436,580 of those living in Manhattan worked there.

Figure 2 - Commute Flows 2002
(click to enlarge)


Let us compare this with 2002 - 16 years earlier - and see what changed over time.

Below is the data from 2002.  Key points are that during those 16 years from 2002 to 2018, the number of jobs in Manhattan has increased by 512,404 (28.3%) while the number of those living in Manhattan increased by 150,959.  The number living in Manhattan and also working there increased only by 79,061 (18.1%).  Over the same period, the number of those living in Manhattan and commuting out increased by 71,898 (49.2%).  In other words nearly half of the increase in population of workers living in Manhattan during this period commuted out.  This resulted in an increase in the percentage of those living in Manhattan and commuting out from 25% to 30%.

Paradoxically, the addition of workers living in the job center resulted in a larger percentage commuting out of Manhattan - from 25% in 2002 to 30% in 2018.  We see this in figure 3 below:

Figure 3.  Commute flows - 2018 vs 2002
(click to enlarge)


Commute Distance and Direction:

In Figure 4 we see the changes from 2002 to 2018 in where and how far workers residing in Manhattan commute.  In that 16 year period, those commuting more than 10 miles to work increased by 40,000 - from 77,000 (12.1%of resident workers) to 107,000 (14.5% of residents), an increase of 39%.

Figure 4: Manhattan Residents
Commuting Distance & Direction
(click to enlarge)

In Figure 5, below, we see the changes from 2002 to 2018 in how far workers commuting into Manhattan travel.  In that 16 year period, those commuting more than 10 miles to work increased by 162,000 - from 698,000 (39%of non-resident workers) to 860,000 (37% of non-residents).  The percentage decreased but the sheer number increased.

Figure 5: Manhattan Non-Residents
Commuting INTO Manhattan - Distance & Direction
(click to enlarge)

The places that people commuting out of Manhattan is also available from "OnTheMap" by distance range.  The 10-24 mile commute range is shown below.

Figure 6: 10-24 Mile Commutes of Manhattan Residents
Shown in Purple
(click to enlarge)

Remarkably, workers are commuting from the most expensive major county in the US to much cheaper suburban areas, usually considered "bedroom communities".

Congestion and Time Lost to Commuting

The result of this density and concentration of jobs and housing has been some of the worst congestion in the world.

Those arguing that high density results in less commuting need to deal with the reality that the densest county in the US has seen a significant increase both in the number of commuters, and in their miles traveled to work.

The reality is that nearly 4 out of 5 of those who work in Manhattan commute from outside - often the suburbs or one of the more suburban parts of NYC such as Staten Island.  New York commutes take the longest time in the US.

Figure 7 - Commute Time
(click to enlarge)


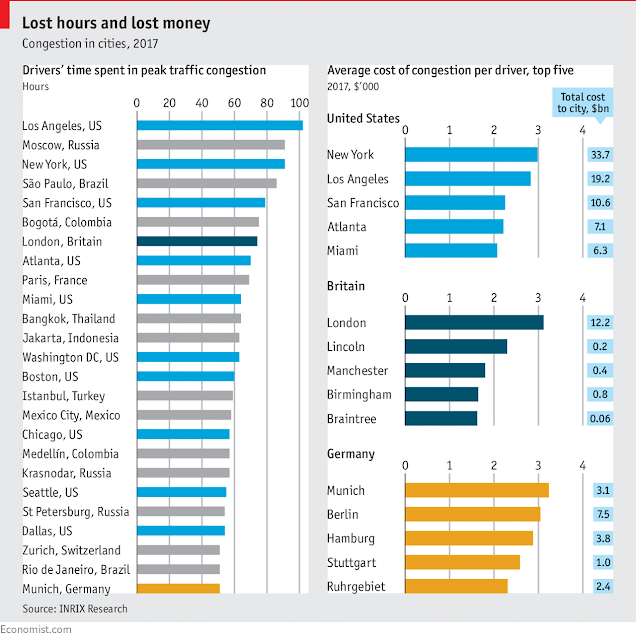
Fortunately, NYC has an excellent (and expensive) public transit system.  Still congestion is worse than almost all other cities in the entire world.  The following chart from the Economist shows that in time lost to congestion, NYC is second only to LA, and tied with Moscow.  In terms of cost of congestion per driver, NYC is the absolute worst in the world.

Figure 8 - Commute Time Lost to Congestion

Conclusion:

Increased density does not result in better commuting.  It simply concentrates the congestion, and distributes the concomitant pollution to the suburbs.

Monday, April 26, 2021

Ridiculous RHNA ("Ree-na") - Part 3

Ridiculous RHNA ("Ree-na")

Part 3

All kinds of housing for all kinds of people

(Link to this post for sharing:

https://meetingthetwain.blogspot.com/2021/04/californias-2021-rhna-bills-part-1.html)

Summary:

We show that only 5% of CA cities and counties build as many houses as projected by their recent "Regional Housing Needs Allocation" goals. The other 95% didn't "make their RHNA numbers" and are therefore subject to "streamlining".  ("Regional Housing Needs Allocation" is abbreviated RHNA and pronounced "Ree-nah".)

Examples of jurisdictions large, medium and small show CA's Housing and Community Development agency's (HCD) RHNA numbers imply dramatically unrealistic growth in housing needs which therefore cannot be met by cities and counties.

Recent public comments in favor of raising RHNA numbers suggest that intent of high RHNA numbers is not to add more housing but to remove any restrictions towns and counties might put on building.

Other posts related to RHNA:


Background on RHNA

RHNA was established decades ago.  The idea was that California's increasing population needed more housing.   To assist cities and counties in planning for that housing the California Dept. of Finance estimates population growth which then become the basis for projected housing growth (RHNA numbers) for a region.  The RHNA numbers are administered by California's "Dept. of Housing and Community Development" (HCD).

An excellent history of the perversion of RHNA for political purposes is here:

https://www.berkeleyside.org/2021/10/25/berkeley-housing-rhna-development

Cities & counties don't actually build housing but simply authorize others to build it.  The only thing cities can do is zone land to accommodate projected growth.  Once the land is appropriately zoned to accommodate projected growth there is nothing else the city can do.  

Until recently, if no one built housing according to the RHNA numbers, HCD didn't do anything.  If the projected growth didn't happen, it was not presumed to be the fault of the city. That has changed with new legislation which implicitly assumes that cities can somehow induce buildings to be constructed by private development companies, or that it is only the cities that are holding back more housing from being built.

We show here:

  1. that RHNA numbers assume a rate of growth far higher than that of the last 30 years,
  2. that housing construction has kept up with population increase,
  3. that there are more housing units than households in every county in California,

We also propose ways to modify RHNA numbers to keep it line with realistic growth.

These facts are important because the proposed bills in the California legislature are based on the assumption that RHNA is a true assessment of future growth.  Therefore, the reasoning goes, if RHNA numbers are not met by a jurisdiction it must be the fault of the the jurisdiction.

Taking these items in sequence: 

                               RHNA Numbers are Unrealistic

California has 58 counties and 482 cities and towns (there is no legal distinction between a city and town) for a total of 540 jurisdictions.  Of those 540 cities and counties, HCD's 2019 "SB-35 Statewide Determination Summary" lists only 28 jurisdictions that comply with the RHNA numbers assigned them.  So, out of 540 jurisdictions only 5% (one in twenty) met their RHNA numbers.

Image 1: Intro segment of HCD 2019 SB-35

HCD's SB-35 Statewide Determination found at:

https://www.hcd.ca.gov/community-development/housing-element/docs/sb35_statewidedeterminationsummary.pdf

A look at the entire list of 28 jurisdictions shows that those meeting their RHNA numbers are small cities representing a tiny fraction of California's population.  RHNA numbers for counties do not refer to the entire population of the county but only the unincorporated parts of the county.  In populous counties like Santa Clara (nearly 2 million people) almost all of the population lives in incorporated cities which have their own RHNA numbers - the population under county control is very small.

-------------- +++ -----------

Some of the rationale given for assigning RHNA numbers is 'to ensure that all jurisdictions contribute to alleviating the housing shortage'.  The RHNA numbers for cities and counties are unrealistic and shows no relation to either historic growth patterns or any housing "shortage".  We show examples of small, medium and large jurisdictions for which RHNA is unrealistic.

Examples of extraordinarily unrealistic RHNA allocations

At the small end, consider Alpine County.  It borders Nevada just South of Lake Tahoe.  It had a total population of 1,200 in 2000, 1,175 in 2010 (decrease of 25) and an estimated 1,129 (decrease of 46) residents in 2019.  Over 96% of the land in the county is owned by the US as a National Park or National Forest.

Image 2:  Alpine County: Population 1,129 & Declining

5 housing units for every household
Failed to meet their RHNA goals and therefore subject to monthly fines up to $100,000.

According to the US Census, Alpine County (2019) comprised 350 households.  Home ownership is 84% as of 2019 compared to 64% for the US.  There are 1,782 housing units in Alpine County, i.e., about 5 housing units per household - meaning there are 1,432 are mostly empty vacation homes.  I.e., there are 4 empty housing units for every occupied one.

Image 3:  Alpine County: RHNA 
Alpine County RHNA mandated 11 "Above Moderate" housing units.
If only 10 were built Alpine could be subject to monthly fines up to $100,000 under AB 215.

With a population declining over 19 years, far away from the expensive coastal cities, almost everyone owning their home, and five housing units per household what is the possible justification for assigning any RHNA requirements at all to Alpine County?

Image 5:  HCD Determination
Not enough "Above Moderate Income" housing built in
298 Cities and counties so state laws for those that didn't meet their RHNA numbers kick in.

On Page 2 of 6

For Alpine County it is clear that RHNA devoid of any rational purpose.  Are there any other counties in a similar situation?  It turns out that there are a baker's dozen counties like Alpine County with small and declining populations (from 2010 to 2018), excess housing units, and high home ownership.  Throw in two more that have trivial increases and we have 15 rural counties without a housing problem yet potentially subject to high fines under Chiu's AB-215.

13 Counties Losing Population (plus 2 that didn't gain much)

  1. Sierra County              (33)  Population decreased by 33
  2. Alpine County             (21)  Population decreased by 21
  3. Calaveras County      (421)         "          "                  421, etc. 
  4. Del Norte County    (1,389)
  5. Kings County          (1,320)
  6. Lassen County        (3,984)
  7. Modoc County             (74)
  8. Mono County             (380)
  9. Mariposa County       (122)
  10. Plumas County          (234)
  11. Siskiyou County         (288)
  12. Trinity County            (151)
  13. Tuolumne County      (625)
  14. Amador County             +3    Population increased by   3
  15. Inyo County                 +31    Population increased by 31
AB 215 would allow the imposition of monthly fines of from $10,000 to $100,000 on these counties.  For Alpine County, $100,000/month works out to about $100 per month for every man, woman and child or about $3,600 per year for the typical household - probably more than their property tax - solely because no builder decided to put up housing in a sparsely populated county with a 5-to-1 housing surplus, and a declining population where 85% own their own home.

-------------- +++ -----------

For small jurisdictions, consider Amador City.

There are many small towns in California with declining populations as well.  Consider the town of Amador.  US Census 2019 population estimate of 190 down from 195 in 2000.

Image 4:  Amador City: Population 190 & Decreasing


Amador is among the 95% of California cities and counties that failed to meet their RHNA.  As in Alpine County builders didn't construct enough "Above Moderate Income" housing units so they get the full brunt of state law, just like Alpine County - see image 5 below from 2019 HCD.

Image 5:  HCD Determination
Not enough "Above Moderate Income" housing built in
298 Cities and counties so state laws for those that didn't meet their RHNA numbers kick in.

-------------- +++ -----------

For middle-sized jurisdictions, consider Pasadena.  

Image 6:  Pasadena, California
Home to the Rose Bowl

Since 1990 it has grown from 131,591 residents to 141,029,  i.e., an increase of 9,438 residents over 30 years or 315 residents per year.  It now faces a RHNA of 9,409 housing units over the next eight years.  This means HCD's numbers imply housing for an additional 23,522 residents (based on Pasadena's current household size of 2.5 people) or 2.5 times more residents in the next 8 years than they have increased in the last 30 years.  In 8 years that averages 2,940 more residents every year from RHNA vs. the actual 315 annual population increase over the last 30 years.  This is nearly 10 times more growth than the historical average!

-------------- +++ -----------

For large jurisdictions, consider Los Angeles, California's largest city.  Between 1990 and 2019 it grew from 3,485,398 residents to 3,979,576,  i.e., just over 500,000 residents in 30 years or about 16,700 new residents per year.  LA's RHNA allocation for the next 8 years is 82,000 housing units as seen in LA's City Housing Element Plan (page 79).

At LA's current 2.8 person household size this implies a growth of 229,600 residents in 8 years or 28,700 residents per year vs. the 16,700 residents per year over the last 30 years.  This is an addition of 12,000 more residents per year than the 30-year historical average.  In other words, RHNA projects growth 170% above the 30-year actual growth rate.

Image 7:  Los Angeles, California
Nearly four million residents
Los Angeles
Growth of 16,700 residents per year over the last 30 years.
RHNA implies 28,700 residents per year over the next 8 years.

Los Angeles in 2015 had 1,478,666 housing units for 1,383,869 households for a surplus of  95,000 housing units, i.e., nearly 7% more housing units than households.

Reason for Unrealistic RHNA numbers

The following SF Chronicle article from July-August 2020 makes it very clear that the point of higher RHNAs is to make sure cities and counties can't meet them.  


Quotes from article:

“If we got a RHNA number in line with the Southern California number, we would increase another 50%, which would mean more counties would not be hitting their number, which would mean that housing would be streamlined in those communities,”

"Matt Regan, who heads up policy at the Bay Area Council, a pro-business trade group, said he supports the highest possible number so that developers will be able to get quick approvals by doing 10% affordable."

When jurisdictions fail to meet their unrealistic RHNA goals, state mandated "streamlining" kicks in.  This means no public notices are required, and builders can put in only 10% "affordable housing" instead of city mandated numbers which are typically 15% or higher.  There are also reductions or eliminations of off-street parking requirements.

Conclusion to Part III

We have seen that failure to meet RHNA goals is not due to anything the cities and counties are, or are not doing but simply because RHNA is absurdly unrealistic in it's projections for growth.  RHNA needs to be radically altered, or simply abolished as it is extraordinarily unrealistic.


Monday, November 2, 2020

Mental Health Considerations in Police Work

We received a very informative description about mental health issues in police work.  This is reprinted with permission from an email of Sunnyvale's Public Safety Chief, Phan Ngo.

Link to this post for sharing: https://meetingthetwain.blogspot.com/2020/11/mental-health-considerations-in-police.html


--------------- begin included email ------------

Please see below regarding thoughts of DPS partnering with mental health. 

Current Sunnyvale DPS procedures


DPS responds to mental health calls for service with a minimum of two officers to ensure the scene is safe. Based on the details of the call additional resources such as more patrol-based personnel, fire and ems responders, paramedics, the Mobile Crisis Response Team, and a number of NGO resources such as Uplift (Eastfield Ming Quong) and Emergency Psychiatric Services at VMC can be accessed. All of these services rely on DPS to provide the scene safety needs and evaluation of the caller’s mental health status for every call. On all responses DPS personnel provide referrals, problem solving capabilities as well as enforcement appropriate laws.


Santa Clara County


Santa Clara County Behavioral Health Services operates a Mobile Crisis Response Team (MCRT) Monday – Friday from 0800 – 2000 hours. This team conducts phone call screenings and may arrange a response within the county. A prime example of their work is the MCRT’s response to assist DPS on a recent 14-hour barricade that was resolved peacefully. Although our request for MCRT was made after their regular work hours, the clinicians responded and assisted DPS in an attempt to negotiate a peaceful surrender of the suspect - who had significant mental health issues.  


Santa Clara County Police Chiefs’ Association


           It’s been a longstanding practice to have a police chief in Santa Clara County represent the County Police Chiefs’ Association as a member on the Santa Clara County Mental Health/Behavioral Services Committee. It is through this process that the police chiefs and the County collaborate on operational and policy issues.


DPS is aware of the national discussion regarding police response to mental health calls. We continue to work with our County and NGO partners to evaluate how we handle these calls to best serve our communities. Thank you.


Phan


--------- end included email ----------

Saturday, July 18, 2020

Sunnyvale Dems Picnic Questions

Sunnyvale Dems' Picnic
With Yummy Questions!


On July 18th, 2020, the Sunnyvale Democratic Club will hold their annual picnic.  Because of Covid-19 it will be a virtual 'picnic'.

The club had a brainstorming session and came up with some interesting questions to discuss.  A selection are reproduced below with my answers - written July 16th, 2020.


Some of the topics talk about allocating money.  I need to point out that it is not at all clear what the economy and therefore the city budget will look like over the next few years.  

The state government faces a $54 billion deficit this year.  It will likely be filled partly by changing the allocation of sales and property taxes as happened in the last recession.  The state will get more and the city will get less.  In addition, it is highly likely that sales taxes will be lower in the next two years. They are a sizable part of the budget.  With all those cuts in the future, it will be difficult to keep the city services at the current level.  It is impossible to say how much money can be allocated for items not currently in the budget.

--------------------------------  Question 1  --------------------------------  

Question 1: What is the role of the city in recovery, resilience, and regeneration as we deal with the Covid-19 crisis and the long-term climate change emergency?

Answer:
Covid-19 should be in the history books in a year or two, while we haven't really begun to see the effects of climate change. When we do see the effects of climate change, those effects will be with us for thousands of years.

Covid-19: as mentioned, budget constraints are unknown at this point but it is likely they will be severe.  The city has its own "bully pulpit" it can use to try to rally people to work together.  It can get companies that are still doing well to help other companies and individuals in special cases.

Climate Change: The effects of climate change will be most easily seen in sea level rise.  The earth's temperature is already nearly 1 deg. Celsius above pre-industrial levels.  The last time the temperature was this high, sea levels were higher by 6 - 9 meters (20 ft - 30 ft).  See chart below from: “Rising Seas: How Fast, How Far?” – the Earth 101 lecture”https://www.youtube.com/watch?v=vhLOZ_bbgzQ


Ice melts slowly relative to human time frames so it will take some time to see the 20-30 ft sea level rise that is already "baked in" (so to speak) with the current 1 degree Celsius.  Since the GHG emissions are continuing, it is likely we will see at least 13 meters (43 ft) before emissions are brought under control.  

This is what Sunnyvale will look like with 5 meters of sea level rise.

From:

Sunnyvale needs to adapt by halting housing development north of 101 and 237.  Trying to fight it with sea walls is pointless - just delaying the inevitable.  This map with 5 meter rise is currently projected to take 150 years (could be sooner) to fully work out, in the best case of GHG emissions reduction.

Sunnyvale needs to get serious about climate change.  The current climate action plan is not strong enough, relying way too much on VMT reduction and not enough on other means.  We should serve as an example to other communities by banning natural gas in new construction, demanding solar panels on all new office buildings (as San Francisco has done for years), and providing chargers everywhere for the 50% of Sunnyvale who are renters and will need access.

--------------------------------  Question 2  --------------------------------  


Question 2: What will be your priorities to maintain given the cuts to programs caused by budget impacts from the pandemic?

Answer:
I hope we can maintain everything but at a reduced level.  Reduced library hours, reduced park maintenance, etc.  Public safety is nearly half the general fund budget but it is hard to reduce.  No one wants to call 9-1-1 and get an answering machine.

--------------------------------  Question 3  --------------------------------  

Question 3: How can we support low wage workers to live and work in Sunnyvale? eg through affordable housing and healthcare?  What should be done for those at the bottom of the economy, for example, to deal with disparities from the pandemic?

Answer:
Low wage workers need higher wages.  The current minimum wage is about as high it can go without increasing the prices for everything so much no one can afford to buy a cup of coffee.  We need to get everyone's skill levels up.  This is a long process but it is the only way to lessen the current wage disparity.

--------------------------------  Question 4  --------------------------------  

Question 4: Sunnyvale will approve a new bicycle master plan as part of the Active transportation plan (ATP) this summer. SVBC recommended Sunnyvale spend at least $4M/yr or $40M over the 10 years to implement the plan. Would you support that?

Answer:
It is not at all clear there will be any extra money in the budget for the next several years.  Besides the budget constraints I mentioned earlier, if "work from home" really takes off, we may see a mass exodus from the entire SF Bay area.  A lot of people I meet here would rather be back at a place they consider "home" and if they can work from home in Ohio, Georgia, or other countries, they will.  This may further reduce taxes and therefore the budget.  We need clarity on future revenues.

--------------------------------  Question 5  --------------------------------  


Question 2: What can we do to prevent small and medium businesses from being forced out of the city by rising rents?

Answer:
I don't know that rent increases are going to be as significant a threat to small businesses as other factors.  

One, of course, is the continuing rise of online retail.  A more recent threat is new laws from Sacramento such as SB-330 that allow developers to decline any one zoning rule that they choose.  

The zoning rule builders seem most interested in declining is the requirement to have retail in mixed use areas.  They prefer to replace retail with housing because housing is more profitable.  Areas zoned for mixed-use (retail and housing) are being bought up for housing only.  If this continues, you may have to go to South San Jose to buy anything in a "real" store.  We need Sacramento to realize there are other needs in a city besides housing.


--------------------------------  Question 6  --------------------------------  

Question 7: How much funding are you willing to dedicate every year to implementing the Climate Action Plan ‘next moves? $1M/yr? $5m/year? $10M/yr?

Answer:
I expect we will be struggling to avoid further budget cutbacks.  Spending more money is unlikely.  I think implementing the climate action plan is going to need to come from regulation of current activities.  

The biggest thing I think we can do is ensuring there are more public chargers for the coming onslaught of new (and later used) electric cars.  50% of Sunnyvale residents are renters and they will need to be able to have access to chargers if we want to eliminate GHGe.

The other thing is to start eliminating "natural gas" connections in new construction and start planning to eliminate natural gas from existing buildings.

--------------------------------  Question 7  --------------------------------  

Question 7: Do you support a vacancy tax?

Answer:
Houses held vacant was a real problem in Vancouver, BC and they imposed a vacancy tax.  It worked for about 6 months and then it didn't.  The vacancy rate in Santa Clara county is about 7.5% while in the US as a whole it is about 15% (including vacation homes).  This is more a fear than a reality in our area.  C.f., 

--------------------------------  Question 8  --------------------------------  

Question 7: What level of affordable housing do you support for new development? 15%? Higher or lower?

Answer:
I have heard some cities are able to impose a 20% requirement without impeding the amount of housing built.  It partly depends on the requirement for different categories such as "very low income", "moderate income", etc.

--------------------------------  Question 9 --------------------------------  

Question 7: Do you agree that Sunnyvale should have a goal of 10% of local trips being by active transportation mode (walk/bike/scooter) by 2030? What actions would you support to accomplish this?

Answer:
The question does not make clear what the motivation behind the 10% local trips goal is.  I will guess that the goal is Greenhouse Gas emissions (GHGe) reduction.  The UN's Intergovernmental Panel on Climate Change (IPCC) has stated that we need to get to zero GHGe, so anything that reduces GHGe is a goal I heartily endorse.  However, switching 10% of local trips to walking, biking, etc., will prove difficult.  The share of commuters who use active transportation is currently about 3.3% nationwide (0.6% bike, 2.7% walk).  See chart below:

Above from:

We can expect a little more in the SF Bay Area because the weather is better, but not too much more.  I am open to ideas on how to the percentage that bike to work.

For further background on the challenge of GHGe reduction consider the following chart from the CAlifornia Air Resources Board.  It shows that the GHGe from "transportation" are 40% of which 28% is due to "passenger vehicles".  About 30% of that 28% of personal vehicles includes GHGe from pickup trucks which are mainly used for work - plumbers, etc.  That leaves only about 20% due to strictly personal use.  Eliminating 10% of that 20% would result in a total reduction of 2% in GHGe for Sunnyvale.

Sources of GHG Emissions in CA in 2017

As another reference point, consider that from 2007 to 2017, total CA GHGe declined by 13% (490 MMTCO2e) due to existing California rules and regulations.  (MMT = Million Metric Tons").  See following chart from "California Greenhouse Gas Emissions for 2000 to 2017":


Many more questions that I did not have time to answer in written form.