Mother Nature Bats Last
 |
| ...and she's coming out swinging! |
Sea Level Rise effects on San Francisco Bay, US, and World
Link to this post (for sharing): https://meetingthetwain.blogspot.com/2018/02/mother-nature-bats-last.html
Following up on a previous post on Sea Level Rise:
http://meetingthetwain.blogspot.com/2017/04/bye-bye-shanghai.html
Discussion:
Interesting article in the SF Chronicle on a Union of Concerned Scientists (UCS) paper regarding sea level rise. The UCS report, titled "When Rising Seas Hit Home" details the communities affected, mostly along the eastern Sea Coast of the US.
 |
| https://www.ucsusa.org/sites/default/files/attach/2017/07/when-rising-seas-hit-home-full-report.pdf |
2045 on Left, 2100 on Right
 |
| https://www.sfchronicle.com/bayarea/article/Scientists-expect-floods-in-Bay-Area-from-rising-11284750.php |
You may notice in the above map that some cities like Foster City and East Palo Alto disappear entirely, while others, like Mountain View and Sunnyvale, lose major sections of their residential and commercial areas near the bay. A Sea Level Rise Viewer from the US National Oceanic and Atmospheric Administration (NOAA) shows the effect of a 6 ft rise in Sea Level, approximately matching the 2045 scenario above. See below:
Sunnyvale, CA

Sunnyvale, CA

Oakland, CA


Tool available at: https://explorer.adaptingtorisingtides.org/explorer . Covers SF Bay area only
Similar tool covering the entire US available at:
https://coast.noaa.gov/digitalcoast/tools/slr.html
 |
| 3 foot rise - by 2040 or 2050 |
San Francisco - 8 foot rise - before 2100

For San Francisco, there is a good analysis of the history of the SF Bay and what is in store with sea level rise here: https://projects.sfchronicle.com/2016/sea-level-rise/part1/
Unfortunately, it dates from 2016 and since then we have learned that things are deteriorating faster than thought at that time. In fact, things always get worse faster than we think so even what you are reading now will likely seem excessively optimistic in another 10 years.
SF Airport (SFO) - 2 foot rise - by 2040

Tool available at: https://explorer.adaptingtorisingtides.org/explorer . Covers SF Bay area only
Similar tool covering the entire US available at:
https://coast.noaa.gov/digitalcoast/tools/slr.html
South Florida
 |
| NOAA Map for South Florida - 6ft rise |
Property loss due to Seal Level Rise
 |
| http://www.wunc.org/post/map-areas-most-affected-sea-level-rise#stream/0 |
The report from the UCS shows areas abandoned based on the definition of "chronic inundation" = if an area is flooded 26 times a year (every other week, on average) it will be abandoned.
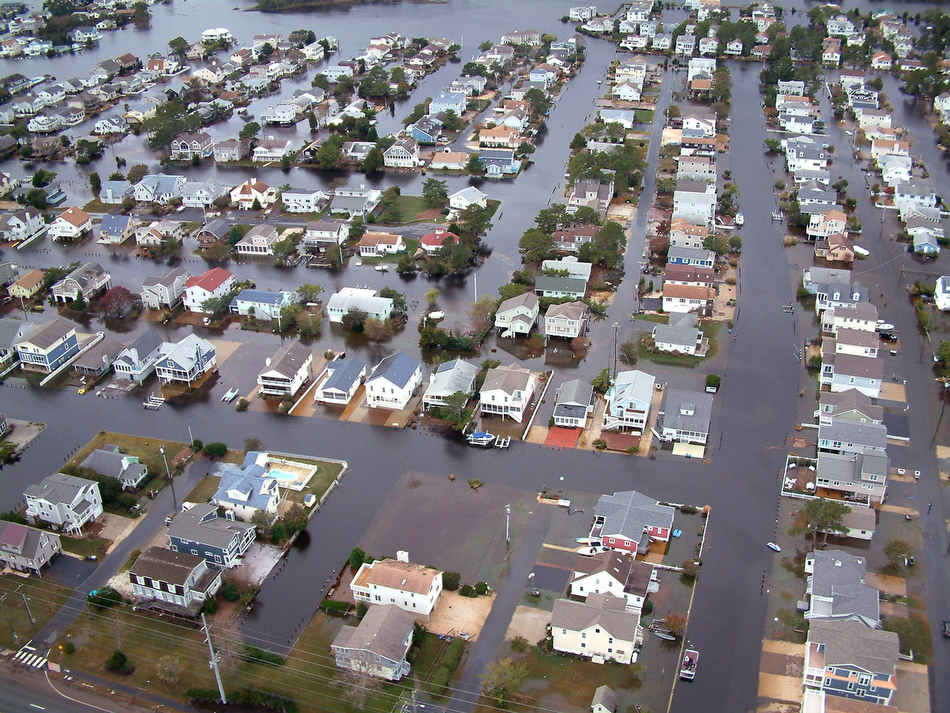 |
| Aftermath of Hurricane Sandy in Delaware http://blogs.pjstar.com/eye/2012/11/02/aerial-photos-of-destruction-left-by-superstorm-sandy/ |
For the San Francisco Bay area this is just a return to what it used to be before Europeans started populating and filling in low lying land. This is seen in the following map from Wikipedia of what the SF Bay looked like around 1800. The land that will be flooded in the years to come was once marsh land. It was filled in for housing. It should never have been built on.
 |
| https://en.wikipedia.org/wiki/San_Francisco_Bay |
Sea level rise will not be like a bathtub filling up, slow and steady. For a while nothing will appear to happen, then a King Tide will flood some underpasses and low-lying neighborhoods. It will be noted in the papers but nothing will be done.
 |
| Mill Valley - 2012 |
Everyone forgets about it. Then a storm floods the same low-lying places again. There is some discussion of improving drainage or building better sea walls. A study is done and a report issued but no action is taken. Then nuisance flooding happens every month.
 |
| Nuisance Flooding Charlotte, North Carolina |
After the first few occasions, no one leaves. Then after every successive flood, more people move away.
 |
| Rock Springs, San Jose, 2017 "California’s third-largest city remains swamped with contaminated water" https://www.wsj.com/articles/floodwaters-linger-in-san-jose-1487865014 |
At some point no one will buy property in the affected area. The last stragglers in the area hope for some government aid to help them relocate. Finally it is officially abandoned and made into a protected marsh.
Sea Walls?
People always ask why can't we build sea walls like the Dutch. I wonder if they are thinking of this levee in the Sacramento area?

New Orleans had lots of levees too. Didn't do them much good.
 |
| http://www.theadvocate.com/baton_rouge/news/environment/article_13e4b4e8-dba0-11e7-b19a-db5cbb943c04.html |
To protect the threatened areas with sea walls or levees the entire SF Bay needs to be enclosed. If only one city, say Mountain View, is enclosed, then water from neighboring areas will come in around the walls. So a large continuous sea wall will need to be properly maintained for 1,000 years - the expected duration of the sea level rise. Care to trust your home to state and county infrastructure maintenance for 1,000 years??
 |
| Do you reaallyy want to trust gov maintenance of infrastructure for 1,000 years? |
Oroville Dam?
 |
| https://www.cnn.com/2017/02/12/us/california-oroville-dam-failure/index.html |
"Oroville – It has been one year since water spilled down the Oroville Dam emergency spillway for the first time in history, spelling near-disaster for nearly 188,000 residents downstream.
"As erosion on that unlined hillside intensified on Feb. 12, water headed upward toward the concrete weir and there was fear that uncontrollable releases from the reservoir behind it would come crashing down on the cities below. Residents were given just one hour to evacuate that afternoon."
 |
| Faulty construction and poor maintenance resulted in the evacuation of three counties. https://www.mercurynews.com/2018/02/11/oroville-dam-one-year-after-crisis-distrust-lingers-big-questions-remain/ |
The Oroville Dam is only 20 years old. If this is what happens in 20 years, what structures can we trust for 100 years?, 1,000 years?
How Long Will It Last?
Think of taking an ice cube out of your refrigerator and putting it in some warm water. It melts in 10 or 20 minutes. To refreeze it will take 10-12 hours. Similarly, the dissolving of glaciers may persist for hundreds of years raising sea levels but it will take a new ice age to reform glaciers and reverse the effects.
1941 (Left) 2004 (Right)
 |
| https://cpo.noaa.gov/warmingworld/glaciers.html |
And the effects of global warming will persist long after we achieve a carbon neutral civilization. "There is a widespread consensus that substantial long-term sea-level rise will continue for centuries to come even if the temperature stabilizes" https://en.wikipedia.org/wiki/Sea_level_rise#After_2100
Dr. David Archer of the U. of Chicago Geophysical Science Dept. has an estimate of about 10,000 years, though "it's complicated". More here:
How Fierce?
Climatologist Dr. James Hansen of Columbia University explains the super-storms we will likely see in the future as the oceans heat up and release more energy into hurricanes and typhoons.
 |
| https://www.youtube.com/watch?v=JP-cRqCQRc8 |
As explained in the video, the existing climate models have been underestimating the heat content that will be released in future storms. The storms will have higher winds and become bigger. In earlier times, when the earth was about 3 degrees Celsius warmer than it is now, storm waves tossed gigantic boulders weighing 1,000 tons (that's 1,000 x 2,000 lbs = 2,000,000 lbs) up on the shore in the Bahamas as seen below (excerpted from the 15 minute video cited above). Note woman in lower right shown for scale.
 |
| 1,000 ton boulder tossed onto land by storm waves. |
For comparison, a large male African elephant weighs around 6 tons. A 1,000 ton boulder is about 160 elephants.
 |
| One boulder weighing as much as 160 of these guys tossed though the air onto land. |
As the energy stored in oceans in the form of heat increase, they will create ever bigger storms, such as Typhoon Tip, shown below overlaid on a map of the US for a sense of scale.
 |
| https://www.scientificamerican.com/article/earths-strongest-most-massive-storm-ever/ |
This typhoon (hurricanes in the Pacific are called typhoons) reached Japan resulting in 86 deaths. It weakened by the time it hit Tokyo, but still caused tall skyscrapers to sway in the intense winds.
Here is Hurricane Irma (2017) overlaid on a map of Texas for comparison:

The effects of a large storm in Europe late 2017:
 |
| Sea Wall Destroyed |
 |
| Train Car Blown Over |
Over half of all the human produced Green House Gas CO2 emitted since the industrial revolution was emitted in the last 30 years.
 |
| https://www.ucsusa.org/publications/catalyst/su15-documenting-fossil-fuel-companies-climate-deception |
So that's why we can't have nice things building sea walls won't work.
