Search This Blog

Saturday, June 17, 2017

The Future of Energy in 22 Charts

Perma-link: http://meetingthetwain.blogspot.com/2017/06/the-future-of-energy-in-20-charts.html


Making Progress!

I offer the following 'uplifting' view of renewable energy as a counterpoint to the somewhat discouraging view of Sea Level Rise in "Bye-Bye Shanghai" at:
http://meetingthetwain.blogspot.com/2017/04/bye-bye-shanghai.html


US Wind + Solar Hit 10% of total Production!


Iowa, Kansas, and Oooooklahoma lead US with 25% or more electricity from Renewable Energy (RE)!  If Iowa can hit 37% wind power so can Texas, Kansas, and many others.


Both charts from: https://www.eia.gov/todayinenergy/detail.php?id=31632

Utility Solar growing fast! 

First because it was mandated, but now 'cuz it's cheap!


Above from: https://www.eia.gov/todayinenergy/detail.php?id=31072#tab1

California's solar takes a big bite out of mid-day energy imports lowering the cost of electricity below zero!  "...almost 40% of net grid power produced during the hours of 11:00 a.m. to 2:00 p.m"


More electricity storage will smooth out the early evening peak usage and lower prices at that time.

Above from: https://www.eia.gov/todayinenergy/detail.php?id=30692

US wind more than doubles! 


... net electricity generation in US in 5 years!  Now 5% of electricity generation.


Source: https://www.eia.gov/todayinenergy/detail.php?id=31032

Wind passes hydro-power!  

Note the incredible rate of growth of wind power!  From about 8,000 Mega Watts to over 80,000 MW in about 11 years.  Now = 5% of total electricity.  If wind does that again, it will be 50% by 2026.


As many have noted, wind power fluctuates a lot during the year, but so does hydro, and so does demand from Winter to Summer.  And if you compare the wind generation chart above with the solar generation plot earlier, you note that wind is lowest (Summer) at the time when Solar is highest and vice versa.  Wind and solar complement each other well.

Above from: https://www.eia.gov/todayinenergy/detail.php?id=30212

First time ever US GHGs from transport are now more than GHGs from electric power generation!  Because coal is being replaced by natural gas which generates about 50% the GHG emissions of coal.


Where is the "good wind" in the US?  The map below shows the best wind (dark blue, red, and purple) is in the Great Plains, the Great Lakes, and in the waters off both the North-East Coast and the entire West Coast.  The Great Lakes alone could power the entire Mid-West.

Coal is declining fast! 


The transport sector is not yet feeling the impact of electric vehicles.  It will soon.
(Distillate Fuel means diesel oil for trucking and home heating.)


https://www.eia.gov/todayinenergy/detail.php?id=29612

Coal close to 1908 levels!  Transport and Natural gas are next to go.


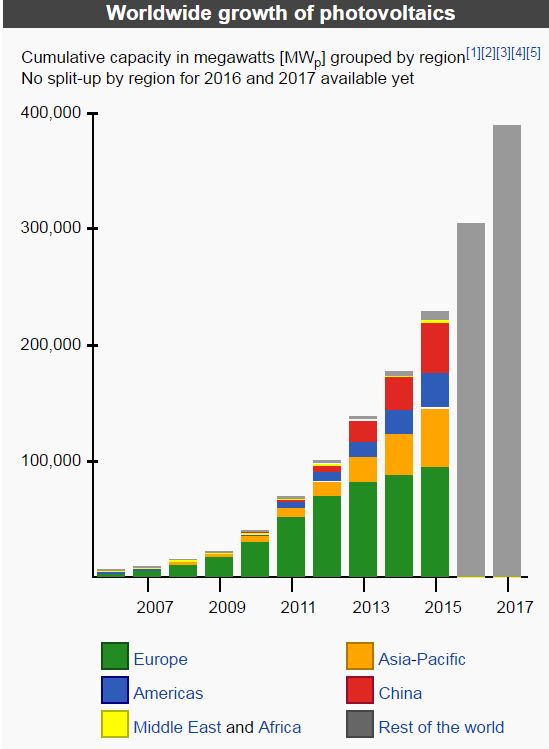
Incredible growth of Solar Power!


But solar represents barely over 1% of total world electricity production. We can't be complacent.  The easy ones go fast.  Resistance grows stronger.  Efforts must be increased to continue the march of progress.

Above chart and table from: https://en.wikipedia.org/wiki/Growth_of_photovoltaics

Hyuuge Potential in US!

The little red empty circle on the lower right is what we use now in the US.

From:
http://www.huffingtonpost.com/rob-sargent/100-percent-renewable-energy_b_9567486.html


The End of Oil Begins in 2022!

"The Stone Age didn't end because they ran out of stones.  The oil age won't end because we run out of oil"  
Sheik Ahmed Zaki Yamani, former Saudi oil minister

So if transport is now about as big a problem for GHG emissions as power generation, when will that significantly decline?  It should show up around 2022 - maybe a year or two earlier or later.  That is when the cost of electric vehicles will equal the cost of internal combustion vehicles.


A Bloomberg New Energy article (whence came the last 3 charts) addresses many concerns about the possibility of electric vehicles (EVs) and find that there are no serious limits.  The projected growth of EVs would use only about 1% of the known reserves of Lithium, and about 4% of the world's reserves of Cobalt.  More here:  https://www.bloomberg.com/features/2016-ev-oil-crisis/

The most "authoritative" predictions of the growth of green energy by "very serious people" have been ludicrously pessimistic.  Below we see the real annual increase in Solar Panels (PV = Photo Voltaic) vs. the International Energy Agency's annual World Energy Outlook predictions.


Nothing can stop an idea whose time has come!


Monday, June 5, 2017

Food Scrap Separation

Summary:

A lot of discussion and emails over the Sunnyvale City Food Scraps Recycling program.  Below are some of my own thoughts followed by a message from the City Manager with links to the studies done and the previous council meetings and relevant documentation.  As far as I know there is no penalty for ignoring the food scrap program at this time but we will all need to change bins to the new duplex forms.

Sunnyvale Food-Cycle web site: https://sunnyvale.ca.gov/property/recycling/scrap.htm

For more info you can ask any question about this topic (or any other) at Sunnyvale "Contact-us" website: https://sunnyvale.dynamics365portals.us/contact-us/ and you should get an answer within 3 working days.


My Thoughts:

Some have said they generate very little in the way of food scraps and have asked if they can opt out and keep their old garbage bin.  In a word: No.  You don't have to put anything in the food scrap part of the duplex bin we will all be getting but you can't keep your old bin.

Having two types of garbage bins would be a logistical nightmare with two sets of garbage trucks cruising around - one of them picking up 2 out of 3 bins and the other picking up the other 1 out of 3. We'd need 16 garbage trucks instead of 8, and twice the number of people driving.  Click on images below to enlarge:


Mountain View has a nice video and diagram of how split bin trucks work.
http://www.mountainview.gov/depts/pw/recycling/garbage/residents/carts/default.asp

My family of four generates a very small amount of food waste per week - 5 banana peels, 12 egg shells, 1/2 cup of coffee grounds - so if it seems a lot of trouble for very little, I sympathize.  However, most people generate a lot more.  I intend to go with food scrap recycling as intended even though we have very few food scraps.  We may take up composting instead. 


Coincidentally, New York City is just now implementing a food scraps recycling program as well, but they are recycling food into compost as San Francisco has been doing since 2009.  Composting has many positive environmental benefits and is discussed here:
http://www.motherjones.com/politics/2009/06/composting-vs-methane-capture-climate-smackdown/

More info on NYC's new composting program here:

I asked the interim city manager about including food waste with yard waste as other cities do.  He told me the nearest plant that can handle both together is too far away and would cost too much in shipping costs.  The current food-recycle plan approximately breaks even.

I do agree that it would be worthwhile to conduct a survey of residents once we reach a time to replace the existing garbage trucks.  For now, we're stuck with the 8 new garbage trucks and can't really change until those reach the end of their useful life which is probably about 7 years ( http://www.government-fleet.com/channel/procurement/news/story/2016/04/audit-66-of-refuse-fleet-needs-replacement.aspx )

The company responsible for the method of food recycling has a web site here:
https://www.forktofeed.com/

A video of the processing of the food scraps into pig food pellets is here:
https://www.youtube.com/watch?time_continue=322&v=qlIOqCPgt7s

The pigs fed this will apparently not be used for human consumption but whatever pigs are used for in non-food ways.

An alternative view on compost and another option of anaerobic digestion and using captured methane as a fuel source is given here: http://appliedmythology.blogspot.com/2013/01/the-shocking-carbon-footprint-of-compost.html

Some have complained about the feeding of waste food to animals as unhealthy.  The food is sterilized and compressed into pellets so the food is probably healthier than the normal "scraps" they might get.  There is more about it here in the FAQ:
http://sunnyvale.ca.gov/Departments/EnvironmentalServices/Garbage,RecyclingandWasteReduction/RecyclingServices/SingleFamily/FoodCycle.aspx

If you were thinking of becoming a vegetarian, the following article might move you in that direction:  What we now feed animals:  http://www.motherjones.com/blue-marble/2013/12/cow-feed-chicken-poop-candy-sawdust


From Mayor Hendricks via NextDoor:


-------------  note from Mayor Hendricks on NextDoor -------------

I am including a link to the meeting minutes from last year where this was voted on. I am also including the phone number to City Staff that could answer your questions. City Staff Call 408-730-7262 https://sunnyvaleca.legistar.com/Calendar.aspx https://sunnyvale.ca.gov/civicax/filebank/blobdload.aspx?blobid=23667

-------------- end note ---------------------------------


Here is the text of the city staff's reply to a message Mayor Hendricks received:

------------------------- begin text 1 from staff -------------------

Thank you for contacting the City regarding your question on food scraps recycling. In response to your message to Mayor Hendricks, here is how food scraps link to greenhouse gas generation--When disposed of in a landfill, food is decomposed by anaerobic bacteria that produce methane, a powerful greenhouse gas, as their waste product. Just as we humans exhale CO2, these bacteria exhale methane. Even if most of the gas is captured and converted to a usable form of energy--electricity or vehicle fuel--burning it produces carbon dioxide, also a greenhouse gas. Food scraps are by far the largest remaining item Sunnyvale residents are disposing in their garbage carts. Food scraps make up 33 percent of the garbage collected from Sunnyvale single-family residences (no other single component is higher than 6.5 percent). The City currently sends 8,000 tons of residential food scraps to Kirby Canyon Landfill in San Jose each year, at considerable ratepayer expense. Using the split cart/split truck method (same as the City does with curbside recycling) allows Specialty to collect a second material in the same truck visit as garbage, so no additional fuel is consumed for collection. Garbage is hauled to Kirby Canyon Landfill in a “big rig” that makes a 54-mile round trip. In contrast, the food scraps are processed just a few miles away in Santa Clara, and are sent there from the SMaRT Station in a condensed, pre-processed condition. Use of the food scraps as an ingredient in hog feed replaces corn and soy that would otherwise be grown on farms, with the associated fuel use, fertilizer and pesticide impacts of farming. So, yes, in many ways, the program will return real environmental benefits, including reduced greenhouse gas emissions. The USEPA ranks feeding food to animals just below feeding “hungry humans” and higher than industrial and compost uses. EPA’s Food Recovery Hierarchy can be viewed at www.epa.gov/sustainable-management-food/food-recovery-hierarchy .

---------------------- end text 1 -----------------

------------------------- begin text 2 from staff -------------------

In response to your message to Mayor Hendricks, here is how food scraps link to greenhouse gas generation--When disposed of in a landfill, food is decomposed by anaerobic bacteria that produce methane, a powerful greenhouse gas, as their waste product. Just as we humans exhale CO2, these bacteria exhale methane. As you note, the Sunnyvale Landfill, which stopped receiving waste 24 years ago, is still producing useable methane, although the quantity has declined substantially. The Wikipedia entry for Newby Island Landfill is out of date, however—Air District records indicate that Newby Island has been flaring all of its collected gas for several years. But even if most of the gas in a landfill is captured and converted to a usable form of energy--electricity or vehicle fuel--burning it produces carbon dioxide, also a greenhouse gas. To put this in scale, food scraps are by far the largest remaining item Sunnyvale residents are disposing in their garbage carts. Food scraps make up 33 percent of the garbage collected from Sunnyvale single-family residences (no other single component is higher than 6.5 percent). The City currently sends 8,000 tons of residential food scraps to Kirby Canyon Landfill in San Jose each year, at considerable ratepayer expense. Using the split cart/split truck method (same as the City does with curbside recycling) allows Specialty to collect a second material in the same truck visit as garbage, so no additional fuel is consumed for collection and collection costs are minimized. Garbage is hauled to Kirby Canyon Landfill in a “big rig” that makes a 54-mile round trip. In contrast, the food scraps are processed just a few miles away in Santa Clara, and are sent there from the SMaRT Station in a condensed, pre-processed condition. The end product is shipped to markets in a dehydrated form that minimizes fuel use in shipping. Use of the food scraps as an ingredient in hog feed replaces corn and soy that would otherwise be grown on farms, with the associated fuel use, fertilizer and pesticide impacts of farming. So in many ways, the program will return real environmental benefits, including reduced greenhouse gas emissions. USEPA research has led to it ranking “Feed animals” just below “Feed hungry people” and higher than industrial and compost uses. EPA’s Food Recovery Hierarchy and related information can be viewed at www.epa.gov/sustainable-management-food/food-recovery-hierarchy . If you wish to take a deep dive into the science on food scraps and greenhouse gases, I recommend the California Air Resources Board (CARB) resources on Short-Lived Climate Pollutants at www.arb.ca.gov/cc/shortlived/shortlived.htm . CARB’s scientists are very firm on the GHG benefits is diverting organics from disposal. Separate collection of commercial organics is now required by law (we collected 273 tons of food from Sunnyvale sources last month) and we expect a state mandate on residential organics in the near future.
---------------

From NextDoor Posters:


----------------- begin excerpt from NextDoor post --------------

To achieve a 75 percent goal of recycling by 2020, each Californian must reduce/recycle/compost an equivalent of 8 pounds per day and dispose no more than 2.7 pounds/person/day (25 percent). These are very informative links if you have time to read through: http://www.calrecycle.ca.gov/Publications/Documents/1538/20151538.pdf https://www.cdfa.ca.gov/ahfss/animal_health/Garbage_Feeding.html http://www.calrecycle.ca.gov/recycle/commercial/organics/FAQ.html So processed kitchen scraps (probably by sterilization to avoid transfer of swine disease) is considered safe. Feeding kitchen scraps to pigs is not an uncommon practice. CA Is following this approach to truly call it recycling. Managing huge composting piles of rotting food may not have been the best option. Split cans were probably chosen because Sunnyvale didn't want to burden us with 4 cans (garbage, kitchen scraps, recycling non organics and garden waste).

----------------- end NextDoor post --------------

Nice video of how successful SF has become to achieving zero waste by composting what they can: https://m.youtube.com/watch?v=Cg3OA1s8-SI
----------------- end NextDoor post --------------


----------------- end NextDoor post --------------

From the City Manager:

---------------- begin included text from City Manager ------------

Staff will be screening the emails to Council and responding on the City’s behalf when appropriate. Our practice is to respond to emails that seek more information. Emails that simply express an opinion (for or against) are for your information and staff does not typically respond. Councilmembers will be copied on all staff responses to emails directed to the Council Answer Point.

Program History

The City Council has taken several actions on this program, as listed below:

In December 2008, Council approved the Zero Waste Policy (RTC 08-358, Council Policy 3.2.4).

On April 23, 2013, Council adopted the Zero Waste diversion goal of 75% by 2020, among other actions.

To assure market outlets for both the commercial and residential food scraps collection programs, on January 5, 2016, Council approved multi-year contracts with facilities that would accept and recycle the materials collected by those programs. (RTC 15-1075)

On September 20, 2016, Council reviewed the results of the pilot program conducted in 2015 and approved Citywide implementation of the residential split-cart/split-truck program. (RTC 16-0844)

About the Program

The primary reason the City is targeting food scraps relates to the fact that, when disposed in a landfill, food is decomposed by anaerobic bacteria that produce methane, a powerful greenhouse gas. Whether it escapes directly from the landfill into the atmosphere or is converted to carbon dioxide when burned in a flare or power generation process, creation of this methane adds carbon to the atmosphere and contributes to climate change.

The City has set Zero Waste goals tied to Policy 3.2.4. The goal currently is to divert 75% of generated waste from disposal by the year 2020. The most recent official state measure of Sunnyvale diversion was 65% in 2015. The Zero Waste Strategic Plan identifies food scraps as by far the largest remaining item Sunnyvale residents are disposing in their garbage carts. A waste characterization conducted for the City by Cascadia Consulting Group found that food scraps made up 33% of the garbage collected from single-family residences. No other single component was higher than 6.5%. The City is already providing food scraps collection service to a growing number of businesses, schools, etc. as it implements the AB 1826 mandate for commercial organics separation.

The 500+ home pilot program conducted in 2016 was effective in gaining high levels of resident participation (73%) and capture of available food scraps (62%). Based on this success, Council approved a Citywide rollout of food scraps service, which is now scheduled to begin in September 2017.  This first phase will provide the new service to single-family homes, duplexes, tri-plexes and mobile homes. (The start of service to apartments (4+ units) that use garbage cart service and the approximately 300 commercial garbage cart customers will be done after the single-family service is up and running.) Based on the pilot results, staff anticipates that at full implementation to the new service will increase single-family diversion by about 4,000 tons per year.

The City and Specialty uses a split cart/split truck system to collect recyclable paper and containers in a single container. Using the same split cart/split truck technology to pick up garbage and food scraps with a single truck allows the City to separately collect the food scraps without increasing the number of trucks and carts in use. This keeps the cost of providing food scraps collection at a modest level and does not increase wear and tear on streets from collection truck traffic.

To keep down the cost of the pilot program, it used retired recycling carts with a 50/50 split. Staff knew, going in, that 50/50 was not the garbage/food ratio for a permanent service, but using carts in hand saved time and money while allowing a good test of resident acceptance of this new behavior. Following the pilot, the cart and truck vendors worked with Specialty to test prototype cart dimensions and came up with cart dimensions that made the garbage portions of the three new cart designs as large as possible without allowing garbage to contaminate the food compartment of the truck. It is worth noting that the City of San Jose is also testing split cart food collection in a pilot area of approximately 6,000 homes.

Residents will continue to use their current black garbage carts until their service route is converted to the new service. Rollout will be at a measured pace to allow staff the time to answer questions about how to use the new service, troubleshoot issues in the field, etc. The pilot showed that separating food from other garbage is a big, sometimes deeply personal change for some residents that can require a good deal of communication.

Current Status
Based on the approved program, equipment orders are on schedule. Specialty Solid Waste and Recycling, the City’s franchised hauler, has placed orders for the split-body trucks and split carts needed to implement the new program. Six of the eight truck chassis (seven route trucks plus one spare) have been delivered to the vendor that installs the truck bodies, fuel tanks, etc. The other two chassis are being assembled and are expected to arrive any day. Cart lids and dividers are currently being produced by the manufacturer with production of the cart bodies scheduled to begin June 2.

Please continue to share any input that you receive from our residents.  It is important for us to track the patterns/trends in the input to inform services, potential program changes, or any additional policy action that we may need to advance to the City Council.  Please let me know if you have any questions.
--------------------------  end text from City Manager -------------

Tuesday, April 25, 2017

Urban Economics

Link to this post for sharing: 

Urban Economics on the Ground

Had an interesting "Forum" on Growth & Transportation last Sunday (April, 23, 2017).  My statements that there are limits to growth and that building more housing does NOT make housing cheaper drew "decidedly mixed" responses - real anger from some, hearty "thank you!" from others.

What follows is an explanation of why this is true.


Greater Density = Higher Prices

For starters we have this readable graduate text in Urban Economics saying high density = high prices.


"First an increase in the population size has fairly straightforward effects. Indeed, a rising population makes competition for land fiercer, which in turn leads to an increase in land rent everywhere [emphasis added] and pushes the urban fringe outward.  This corresponds to a well documented fact stressed by economic historians.  Examples include the growth of cities in Europe in the 12th and 19th centuries as well as in North America and Japan in the 20th century or since the 1960s in Third World countries."  (From page 83 section 3.3.2: Economics of Agglomeration:... by Fujita, Thisse).

Background:

Some disagreement to what I and others said came from tweets by a Ms. Kim Mai Cutler as reported in "SF Curbed" here: 
http://sf.curbed.com/2017/4/24/15407822/housing-cupertino-town-hall-silicon-valley 
with a follow-up conversation here: 
http://sf.curbed.com/2017/4/25/15425050/sunnyvale-housing-growth-apple-goldman

Kim Mai Cutler wrote on housing in San Francisco for TechCrunch: 
https://techcrunch.com/2014/04/14/sf-housing/  
Her contact/bio info is here:
https://www.allamericanspeakers.com/speakers/Kim-Mai-Cutler/394419 .

Ms. Cutler's tweets raise points one hears a lot so... to answer I'll get into the basics of Urban Economics and why higher density leads to higher housing costs.  At the end I'll describe what should happen in the SF Bay Area and then what will happen.

(This is follow-up to my earlier posts explaining very simply why building more won't lower rents here: http://meetingthetwain.blogspot.com/2017/01/live-work-commute-2.html and here: http://meetingthetwain.blogspot.com/2017/02/is-there-housing-crisis.html )

Discussion:

Below is the "standard model" for urban economics.  It shows that the further you are from the city center, the lower the density.  This originated with von Thunen (1826) and has held up remarkably well with appropriate modifications for advancements in technology and economic research.

The above graph comes from (2015) "SPATIAL DISTRIBUTION OF LAND PRICES & DENSITIES - The Models Developed by Economists" by Alain Bertaud at NYU - former principal urban planner at the World Bank.  He wrote the paper specifically to teach basic economics of cities to urban planners. His (very readable) paper is available for download at:
 http://marroninstitute.nyu.edu/content/working-papers/the-spatial-distribution-of-land-prices-and-densities

About this graph, Mr. Bertraud writes "...an increase in population, everything else being equal, would increase both land prices and densities."  In his paper he shows similar charts for many other major cities.

Housing costs must be understood in relationship to income in the region/country.  Central Jakarta may be much cheaper than central NY City in dollars.  Compared to incomes in Indonesia it will be more expensive than distant suburbs.  Housing costs for each city must be considered relative to salaries in that area. See below (click to enlarge graph).

Speaking of NYC, at the forum I said "if building more lowered prices, NYC and Hong Kong would be the cheapest cities in the world."  Ms. Cutler questioned this.  The above graph seems to agree with me.  


To bring this home we compare the prices of a 4 Bedroom, 2,000 sq. ft. domicile in Manhattan, vs. one in suburban Long Island:

East Islip in Suffolk County, suburban Long Island = $619K. One of the more expensive houses in the area.  Most homes there (per Zillow) are more modest:


Same sized living space but now Manhattan - $2M:


Okay, no parking in the Manhattan condo, 10% less floor space, also no front or back yard, so not quite comparable.  At $2 Million it is not the cheapest for the floor space in Manhattan, but it is close - most 4 BR condos are far more - $3M to $5M - see below.

And don't forget to add to your $7,780/mo. mortgage, the monthly Home Owner Association fee of $3,244 - which only goes up over time.

Here is what you can get in Manhattan for roughly the same $619,000 that 4 BR 2,000 SF house in Long Island cost.  A 450 SF 0 BR (studio). with a HOA fee of $386/month.


So, yes, as her tweet said, the average housing unit in Manhattan NY is not much off from Silicon Valley but apples-to-apples please.  Your choice - 2,000 sq. feet and 4 bedrooms and drive to work or 450 SF 0 bedroom and take the subway.  Which bears out yet another graph from Urban Economics:
https://www.sas.upenn.edu/~ordonez/pdfs/ECON%20137/LN1-1.pdf
The graph above says: "For the same price, you can have a big house far out or a small house further in."  I.e., you can't have it both ways.  The above graph is from Econ 137 (Urban Economics) taught at the (Ivy League) Univ. of Pennsylvania by Professor Ordonez, formerly of UCLA.

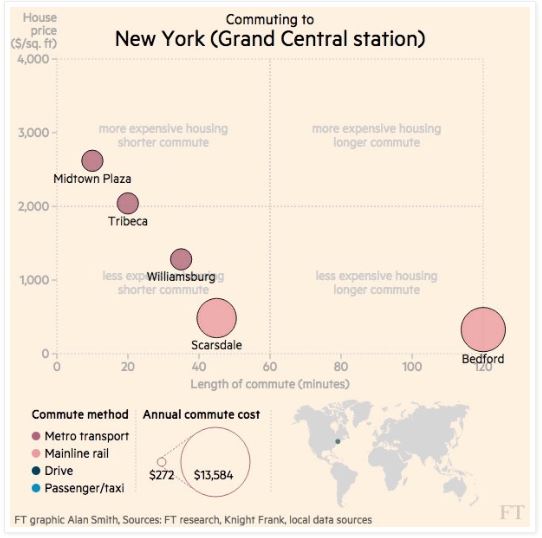
Here are rents courtesy of the London Financial Times - the closer to downtown (on the left) the higher the prices (click figure to enlarge):

Graphs showing the same idea for many more cities here:

So yeah, densely populated NYC is more expensive than the less densely populated suburbs of NYC. Costs/rents are based on distance to the urban core.  
We can't compare costs in the 24-million-people NY metro area to the 7.5 million people in the SF-San Jose metropolitan areas since they have vastly different economic dynamics and income distributions.  Costs must be considered relative to income in the same metropolitan area.  We can compare SF central to other cities in the area.

Here are the rents for a 2 bedroom apt. in these cities (as of 1/7/2017):
San Francisco      - $4,487
Palo Alto             - $3,816
Mountain View   - $3,549
Cupertino            - $3,222
Sunnyvale           - $3,173
Fremont              - $2,500
Livermore           - $2,093

We can see clearly that rents in the SF Bay Area follow the "Standard Model".  And so does NYC as seen below with lower Manhattan commanding higher prices which decrease as you get further away:

Let's look at what happened to NYC over time.  NYC reached a relatively stable population of around 8M in 1950s.  Manhattan peaked in population around 1910-1920 at 2.3M and has declined most of the time since then to currently 1.6M.  Brooklyn peaked in 1950.  

What happened to Manhattan?  A lot of immigrants came in the 1910s and crowded into tenements until they could establish themselves.  Then, as their economic situation improved and transportation got easier with subways and motorbuses they moved into the suburbs of Brooklyn, Queens, and the Bronx.  (This is a perfect example of the logistic curve ("limits to growth") covered more extensively here: http://meetingthetwain.blogspot.com/2017/04/limits-to-growth.html )

Housing was expensive in Manhattan per square foot but cheap per person despite the density because the demand side of the equation didn't have much money.  
You can cram a lot of people into 2 BR tenements - boys in one bedroom, girls in another, mom and pop in the living-kitchen-dining room.  
Day care in 1910
http://philadelphiaencyclopedia.org/archive/settlement-houses/
If Apple, Facebook, and Google were importing thousands of minimum wage workers the same might happen here.

As soon as they could afford a nice home in the suburbs of Brooklyn, etc. they fled Manhattan.  The subways (built in the 1890s) allowed them cheap, easy transport from a suburban home in Brooklyn or Queens into the job center of Manhattan.
Queens, NY ca. 1882 - Before the NY Subway opened it up.
What happened to Brooklyn when it's population peaked in 1950?  The US was booming.  Everyone got a car.  And the sons and daughters of those who had migrated from Manhattan to the suburbs in Brooklyn and Queens?  They now themselves migrated from Brooklyn to the suburbs in Long Island and New Jersey.
Levittown, Long Island, 1955
In both cases, cheaper and more convenient transportation resulted in people going out further for cheaper housing with more space.

The SF Bay Area is not unique.  Everything you hear around SF you hear in other places like Raleigh, NC - "housing costs are outrageous!!  I can't afford $300,000 for a house in the city!  I'm moving to the suburbs!!" What has happened to housing in the US in general looks a lot like a bubble.  Some of this is because so many left the construction trades or retired during the years of the Great Recession and were not replaced so there is a shortage of workers. 


It could get worse as it did in 2007-2008.  The last graph was of just SF - here is another view for the entire US below - crash coming?


I pointed out Hong Kong is also dense and also expensive.  Ms. Cutler then tweeted that half of the housing there is public housing.  Kind of proves my point doesn't it?  If half of the population can only afford to live there because the other half is subsidizing their housing doesn't that mean that very dense Hong Kong is prohibitively expensive?  I am not clear what her point is.  

I mentioned a lot of anger about rents and house prices.  I am not a psycho-analyst but I will guess it comes from three things.

1.  "I did all the right things - got a degree, a good job, married a nice person who also has a good job and I can't afford a nice house near work.  What am I supposed to do??" This is a legitimate question.  Unfortunately the only options are to either wait out the bubble (which I did - it took years), commute a long distance (I did that for years), or get a job in an area you can afford.  Sacramento, Denver, Seattle...  People move.  It isn't the end of the world.

2.  "It is so unfair that these people just like me got a house when it was cheaper" Housing was cheaper but it was still in line with what professionals and engineers can afford.  When I bought my house in 1991, I was a senior software engineer and my wife was a mid-level engineer.  A real estate bubble had just popped.  We bought a "fixer-upper" with 20% down from 5 years of saving.  If we were at the same career stage working for Google or Microsoft in this area, our combined salary would be able to afford the same house under the same conditions.  Housing is up a lot, it is the middle of a bubble, but market rates are determined by what people can afford.  If enough people can afford an expensive house, that is what they will cost.  A single working engineer could never afford a house in the middle of Silicon Valley.  It has always taken two good incomes to afford a house in Silicon Valley or San Francisco or a single very good income.  If you were told otherwise you were mis-informed.

3.  "If only these people would allow more building rents and housing prices would drop."  The entire point of this blog post is to explode that myth.  It isn't true and has never worked anywhere, ever.
"Build more and it will get cheaper" also known as
"There's a sucker born every minute" - PT Barnum
Perhaps Ms. Cutler or someone of similar persuasion can point out where has building more densely caused a decrease in price/square-foot?  If you're one of those people confused by all these people claiming to be experts and telling you they can cut rents by building more, ask them where has that worked?  The economists who study this don't think so, and data doesn't show it.  Where does this idea of "increased density decreases housing costs come from"?  That is not a rhetorical question;  I honestly can't figure out why otherwise intelligent people think it does, contrary to all observable facts.

So what would happen if housing costs dropped in half?  Assume that with my magic wand I instantly cut all rents and housing prices in half.  Not only that but rents and housing prices will only go up 2%-4% a year.

All those who scrimped and saved to buy a house within the last 10 years find that their $1.6M house is now worth $800,000.  They will turn the keys over to the bank and walk away since it will take 15 to 30 years for the house to get back to what they paid for it.  All those builders who just finished all those nice new apartment complexes would declare bankruptcy and do the same - and that means virtually every builder in the area.  Most had to take out loans to buy the land and put up the buildings and at half the rental income there is no hope whatever of making it back for the 30-year duration of the loan.  With so many foreclosures and loan defaults, the banks would be in desperate shape and require massive bailouts from the federal government.  Property taxes would drop in half as well, so libraries would close, teachers would be laid off, and schools would be packed 60 kids to a class room.

Having sustained such enormous losses, banks (any that are left) would be very reluctant to make loans for home buying.  This is precisely what happened in Spain and Portugal during the 2003-2007 housing bubble.  The housing bubble burst - prices and rents collapsed, unemployment soared to 25% in those countries for years - banks were left with huge loan losses.

Spanish Unemployment 25% as Housing Bubble Burst


Some were taken over by the government.  The large Spanish bank "Banco Popular" was bought for one Euro by "Santander" - one of the solvent banks.

With house building stopped, furniture and appliances don't get sold, so manufacturing stops, people lose their jobs, and the GDP contracts.  In Spain the GDP per person went down for most of the 8 years 2007 - 2015 as seen below.

Spanish GDP Drops for 8 Years


In this area we would see sales of iPhones go down the tubes.  Apple has to lay off, and so do all the chip designers, and all the companies that service Apple.  With no one buying anything, advertising revenue drops so Google and Facebook lay off lots of employees.  Companies struggling to survive find cheaper office space and office workers in other areas, maybe other countries.

We have seen this before.

It was called the Great Depression.  Not fun.

The best we can hope for is for prices to go sideways.  In my 35 years in the SF Bay Area I've seen that over and over.  Prices shoot up, everyone starts talking about how much their house is worth or how little rent is back in Grand Rapids, Mich.  Then all the startups that threw venture capital money around like it was chewing gum (and bid up prices on land),  either flame out or their revenues flat-line. House prices and rents come down a little, maybe 10% to 15%, over 3 or 4 years.  Then prices/rents stay flat for the next 5-7 years until the next big surge in startups.  Rinse, repeat.

But you don't have to assume an instant 50% drop in price/rent.  Even a 10% drop is going to have a significant effect.  No housing builder will know how far down prices will go.  They will finish up whatever they started and put on hold anything that hasn't broken ground.  During recessions in the SF Bay area I've seen the bigger builders with deep pockets sit on properties for 10 years waiting for the market to justify going back in.

Banks will also be wary of loaning too much on housing since they won't know how much further housing prices might drop and wouldn't want to get stuck with bad loans.  Banks will then require more down payment and become more selective in whom they loan to.  This will further reduce the pool of those bidding on housing and housing prices will decline a little more to some point where they stabilize - maybe 15% to 40% below the peak.  Housing is a huge part of the economy and this will be the start of a recession.  The lower end of the housing market will drop more than the middle since those are the more marginal buyers who are more likely to have trouble making payments if they are laid off.


Why Move Here?

So why do people migrate to dense, expensive areas?  Because of jobs.  Companies benefit from agglomeration in having all their workers, managers, marketers, and scientists together. Agglomeration increases innovation and productivity - up to a point.

The graph below is from "Urban Economics" by O'Sullivan, 8th edition (standard undergraduate text).  Note it shows that increasing the number of workers increases the costs of living in the city.  It also shows a point of diminishing returns to a company in having all its workers near each other.  There is an optimal equilibrium population.  Less than that is not as innovative.  More than that makes it too expensive to hire and house workers; the additional return on investment isn't enough to justify the increased density (= living costs).  (click on graph to enlarge).


This ties into what I explained in a previous blog about the carrying capacity of a region being governed partly by the logistic equation seen below:
Carrying capacity for most species is simply food.  For 21st century humans it includes jobs, transport, shelter.  I covered this in more detail in limits to growth: 
Schools
Ms. Cutler also had a tweet on school enrollment declining as evidence that we must build more housing.  Evidently some school bureaucrat somewhere said enrollment was declining because housing was too expensive here.  Therefore, we should build more to lower costs so more families with kids can live here.

Below is San Jose Unified's school enrollment over the years.  The bottom of the right hand axis starts at 30,600 so the swings in enrollment aren't as dramatic as first appears.  At the moment, we are pretty much in the middle.  The maximum difference is 2,394 = 7.8% swing from minimum to maximum.  So we are about 4% from the top and 4% from the bottom.  Not a big deal.

I suppose the build-build-build people were saying from 2000 to 2007 that we must build more because of declining enrollments, while from 2007-2012 they were saying we must build more because of increasing enrollments to accommodate all the new families.  Since 2013 it is back to build, build, build because of declining enrollments.

Are Sunnyvale and Cupertino's school enrollment different?  Yes.  Cupertino's looks like Sunnyvale's so we'll just show Sunnyvale.  See below (click on graph to enlarge).

What could explain the above graph?  A lot of things.  Maybe a rapid influx of families overcrowding schools through 2014 then moving their kids to private schools in 2014 through 2017?  Or so many new families moved in that prices got too high and they couldn't afford it and had to move out?  Or maybe they move to Silicon Valley for a job, find an apartment, then later find a single family house in Fremont or Livermore?  Maybe lots of single people move in - double up with 4 in a single family house or town-home - fewer kids?  If you think one guy from the local school system has any special insights then you haven't met a lot of school bureaucrats - they are nice people who care about kids.  They typically don't know any more about urban economics than the average person - i.e., nothing.

Looking at the school enrollment by grade for San Jose, Santa Clara County, and California, we see no particular population bulge in any year.  It is not as if all the new residents just had kids yesterday that will all over-crowd the schools at once.  People move around, finding the optimal location for themselves in terms of cost and commute. (click to table enlarge)
(All the above charts are from http://dq.cde.ca.gov/dataquest/dataquest.asp)

Why Here?
So why here?  Why Silicon Valley?  Yeah, the climate is good here but plenty of people love the four seasons in the East and Mid-West - lovely fall colors, ice fishing & cross country skiing, sailing on the lakes in Summer, etc.
Lake Okojobi in Iowa
The good Wisconsin farmers, Michigan auto workers, Indiana steel workers are spending $200,000+ to educate each engineering graduate in their state schools.  Those great land grant universities in Madison, Ann Arbor, and other towns produce many thousands of engineers yet half of those engineers move to California to find jobs.  We are draining intellectual resources and brilliant people from the heartland.  Maybe the venture capitalists that made the SF Bay Area so successful could make their magic happen in the "Rust Belt".  Midwesterners could stay where  they grew up, and the country could rebuild it's core.

Purdue University Engineering Quad
We are taking from that part of the country the very innovators and STEM people needed to rebuild it.  As a result we get a divided country, and a lot of people voting their anger and despair at the loss of their future and their children.

The cause?  The venture capitalists in Palo Alto don't want to go far to visit their start-ups in the early phase, why should they?  So the startups are all on the peninsula.  Once those startups become successful and enter high growth phase they don't want to move, why should they?  Once their high growth phase is over and they have to start watching the pennies, they expand elsewhere, or get bought up like Sun Micro, or flame out and go out of business like more companies than I can count.  Then yet more startup cos. enter their high growth phase.  Rinse, repeat.

I greatly respect Congressman Ro Khanna for going to the former coal country of Kentucky and meeting with their elected representatives to try to help them with the magic that has made the SF Bay Area so dynamic.
Kentucky - Cumberland Falls
This is not a zero-sum game, folks.  If Kentucky (which is a beautiful state, by the way) and the other parts that helped build this country can become centers of innovation, it doesn't mean Silicon Valley and SF will stop innovating.  The more minds working to solve the problems humanity faces, the better off we all are.

Ro Khanna visiting Kentucky
More on Congressman Ro Khanna's visit to Kentucky here:
http://www.politico.com/story/2017/03/trump-election-silicon-valley-ambassador-appalachia-ro-khanna-236486

Transport

Ms. Cutler also raised the issue  in the transport area of self-driving cars (100% electric, powered from home solar panels, please).  No one knows for sure when or how that will work out, but if past experience and academic research is any guide, it will decrease the perceived cost of commuting as people can make productive use of their commute time.  People will commute further because time in the car is not wasted - they can teleconference in, or work on their laptop, or eat breakfast.

Decreasing the cost of transportation has always resulted in more people fleeing the dense city for the more affordable (because less dense) suburbs.  Silicon Valley will then have a lot of cheap housing and everyone will look at the horrible apartments jammed next to each other with zero set-backs and ludicrously inadequate parking and wonder what we were thinking.

And I'll say, "Good question. What were we thinking?"

Previous blogs related - c.f.: