Search This Blog

Friday, May 3, 2019

Irvine Co. Housing Development in Sunnyvale

New Housing Development in Sunnyvale

Former AMD Headquarters acquired by Irvine Corporation
(click image to enlarge)
The Irvine Co. is planning to build a large (for Sunnyvale) 1,051 unit housing development on the 35 acre site of the former AMD headquarters.  That required a change of zoning from industrial to residential (ITR).

Link to this page for sharing: https://meetingthetwain.blogspot.com/2019/05/irvine-co-housing-development-in.html

Future AMD site as planned by the Irvine Corporation
It is a mildly controversial project and while I agree with many of those who wanted changes I voted for it anyway.  This is to explain why.

The issue came before the Sunnyvale City Council on Tuesday, April 23, 2019 as item number 4 on the agenda.  The agenda with links to documentation is here:
https://sunnyvaleca.legistar.com/MeetingDetail.aspx?ID=672114&GUID=8EB397C3-1701-43B5-BE89-092C311A4D85&Options=&Search=

Item #4 is here:
https://sunnyvaleca.legistar.com/LegislationDetail.aspx?ID=3923629&GUID=80394B41-269A-4665-BCAC-3928786C300A&Options=&Search=

The visual depictions of what is planned are from Attachment 27 "Presentation to Council" on that above link.  Other pictures as shown in associated links.
Stewart Drive Now

Future Stewart Drive with 5-story apartments
Existing trees along Stewart Dr. will be kept
Several Redwood trees will be moved (they can do that!)
The project is to "construct 1,051 residential units, including 944 units in three to five-story apartment buildings and 107 units in three-story town-home style buildings. The unit count includes 45 apartment units for very low-income households and 13 below market rate town-home units. Public improvements include the dedication of a 6.5-acre public park, extension of Indian Wells Avenue to the east to connect with the Duane Avenue/Stewart Drive" (from introduction on Item 4).

3 story Town-homes facing new 6.5 acre park
I first heard about this project about 2 years ago (2017).  Then City Manager Deanna Santana and Trudy Ryan (head of the planning dept.) wanted to inform the council members of the project and some of the concerns they had.

Projected low rise 3-story apartments on Stewart Ave.
One of the concerns was simply the appearance.  It was flat and imposing.  I had seen a building just like it in Santa Clara and really did not want that to be in Sunnyvale for the next 50 years or more.

Indian Wells Ave. (lower left) goes nowhere - it is an access road to residential buildings.
It will be extended to E. Duane Ave. on the upper right in the picture.
This should help traffic flow to Lawrence Expressway.
I gather that the Irvine Corp. made a mistake and paid too much for the AMD land not realizing Sunnyvale's park dedication requirement was higher than that of some neighboring cities.  In order to make it work with the higher than planned cost for parks they needed to put in more units than they had originally planned and were doing everything they could to make it fit.

If they couldn't make it "pencil out" financially as a residential development they would just leave it as a commercial office development - perhaps something like the picture below:
A development in Houston.  This can happen here!
https://blog.chron.com/primeproperty/2014/09/citycentre-embarks-on-major-expansion/
If you think the project shown above would not happen here, think again.  Santa Clara had a proposal for a 50-story office building with a 35-story apartment building and several other smaller ones.  The height has since been scaled down in Santa Clara but the amount of office space is the same.  They traded away open space (park land) to lower the height.  C.f. http://meetingthetwain.blogspot.com/2018/06/50-story-office-building-in-santa-clara.html.

50-Story building in Brooklyn
Might have been one in Santa Clara
Office rents in Sunnyvale have exploded recently as has the cost of land ($10M/acre last year but it might be higher now) and with it the necessity for more height and density to pay for the land.

If the AMD site stayed commercial, we would not get the residences nor the park nor would Indian Wells Ave. provide an alternative route to Lawrence Expressway.  We would get much more traffic because the office buildings would be higher and more densely packed than the existing AMD building.
Drawn in 1900 - not too far from reality.
https://ephemeralnewyork.wordpress.com/2011/12/29/new-york-city-as-it-will-be-in-1999/
In order to make it work and still be attractive, Sunnyvale planning staff worked a lot with the Irvine Co. to find variances that could make it financially viable and still be an attractive addition to Sunnyvale.  I think they did a very good job, all things considered.

The Irvine Co. has another apt. complex (Cherry Orchard Apartments) in Sunnyvale at 250 W El Camino Real, Sunnyvale, CA 94087 (Mathilda and El Camino - behind "Trader Joe's") which isn't too far off from what they are planning for the AMD site.

Click image to enlarge
https://www.irvinecompanyapartments.com/locations/northern-california/sunnyvale/cherry-orchard.html
In addition they are hiring local union labor at good wages instead of trying to cut corners with non-union labor bused in from Southern California or Arizona.

There will be some BMR (Below Market Rate) housing for "Very Low Income" (VLI) households.  Almost no one builds for VLI households.  BMR housing is subsidized by rents from the market rate apartments.  Builders would much rather build BMR housing units for "moderate income" renters with incomes up to 120% of area median income.  That results in more BMR units but with less subsidy per unit.  Some builders are afraid that the VLI tenants cause problems.

Also in my mind at the time was the progress of California Senate Bill SB-50 (and others) through various committees.  There is currently a narrative that Silicon Valley cities like Sunnyvale don't mind allowing in new commercial buildings (and jobs) but balk at allowing new housing thus forcing housing further and further out causing more traffic.  I do not wish to feed that narrative.
More on SB-50 here: https://meetingthetwain.blogspot.com/2019/04/forum-on-sb-50.html

Regardless of whether that is an accurate narrative, the bills that could become laws basically allow builders pretty much free rein in an attempt to foster as much residential building as possible.  I would much rather have the housing we will get with the Irvine Co. project than what SB-50 would force upon us.
207 Boylston, Seattle.  Coming soon to a lot near you if SB-50 passes.
We will get worse traffic no matter what so we'd better learn to deal with it.  If you are a homeowner the increased density will make your home worth more so you can sell out for even more and leave for a less crazy place - if there are any.  This "build more to make it cheaper" nonsense is everywhere - I always ask why, then, are Hong Kong and Lower Manhattan the most expensive areas in the world.  I never get a real answer.

The Irvine proposal is the best we can ask for.  I do not regret voting for it.

Monday, April 22, 2019

SB-50 Suggested Amendments

SB-50 Suggested Amendments

On April 22, 2019 I sent the following letter to all members of the California Senate Governance and Finance Committee.  They will consider SB-50 on April 24th - 26th, 2019.  A full list of the Committee Senators and their emails is at the bottom of this post:
A more readable formatted version of SB-50 is available for download here: 
https://drive.google.com/open?id=1yPfqWvSvnVhbYhFnQVUJVXcpdgiG1vgu

----------------------- begin letter ---------------------

Dear Senator,

Thank you for your service to the people of California.  

While I oppose SB-50 as a “one-size-fits all blunt instrument” here are some suggestions a number of us feel would make SB-50 much more likely to accomplish its stated goals.

1.       Avoid Displacement:  There is high likelihood that builders could use SB-50 to “gentrify” lower income neighborhoods increasing displacement and homelessness. 

a.     Not Apply to Low Income Areas:  To avoid gentrification, the provisions should not apply to jurisdictions where the average income is below the state median.

b.     Require BMR in All Buildings:  The current SB-50 exemption of 10 units or less from any BMR requirement is less stringent than that of Sunnyvale and other communities.  It should be strengthened to at least 15% in all units constructed under SB-50 incentives.

c.       Database of Renters: SB-50 excludes places that have been rented in the previous 7 years.  Without a database of renters cities have no way of enforcing this.  An Assembly bill currently being considered would create a state-wide database of renters.  SB-50 should explicitly state it will not take effect unless and until such a renter’s database is created for any jurisdiction subject to SB-50.

2.       Define “Jobs-Rich” and “Good Schools”:  SB-50 does not clearly define “jobs-rich” and “good schools” even though those are key criteria for imposition of SB-50 mandates.

a.        “Jobs Rich” Definition: A well-defined objective quantitative rule should be written into the law - such as jobs with average pay 50% above the county median – or some similar clear and identifiable criteria.

b.      “Good Schools” Definition: A well-defined objective quantitative rule to define good schools might be schools scoring in the top 50% of the state.

3.       Define “Housing Crisis”:  If SB-50 is meant to “solve” a “housing crisis” in California it should define what it is in clear objective quantifiable means so we know where and when it applies.  It is impossible to solve a problem if you can’t tell when you are done.

a.       Objective Standard Needed: An objective standard needs to be defined which will enable a jurisdiction to know when it is subject to SB-50 so it will know what it needs to do to satisfy that condition.

b.      Not apply to areas not in a “housing crisis” - Of California’s 58 counties only 17 have a population over 500,000 – 23 counties have fewer than 100,000 residents.  In the vast majority of those counties housing costs are at or below the national average.  Thirteen counties are actually losing population. There is no need to give density bonuses in those counties as it will not lower already low housing costs.

4.       Environment: There are eight mentions of the environment in SB-50 but nothing explicitly improving sustainability.  To further strengthen California’s environmental record:

a.       Protect Solar Panels: SB-50 should explicitly state that no building under SB-50 may block the sun from existing solar panels or roofs where solar panels could reasonably be positioned.   Without this, property owners will be afraid to install solar panels for fear they could be shadowed by a nearby building. 

b.      Require Solar Panels: The California Energy Commission and Senator Wiener’s San Francisco have made a huge impact by requiring solar panels on certain types of new buildings under certain conditions.  SB-50 should further those goals by requiring that all new construction under SB-50 be required to have solar panels covering the equivalent of at least 70% of all roof surface area.

c.       Net-zero Buildings: California has made great strides in reducing GHG emissions in power generation, but there is almost nothing being done to reduce GHG emissions from buildings.  SB-50 eligible construction should be “net-zero” GHG emitters.

d.      Eliminate Natural Gas:  Natural gas is the dominant contributor to GHG emissions from both residential and commercial buildings (for space heating and hot water heating).  Forbidding SB-50 eligible construction from having natural gas connections – using heat pumps instead (already popular in Europe) – would set an example for the entire US.  We in Sunnyvale are moving in that direction as are other communities around the world.

Thank you again for your service to the people of California.

Sincerely,
Michael S. Goldman
Sunnyvale City Council Member, Seat 7
I write solely on my own behalf.

Saturday, April 20, 2019

City Power Over Wireless Towers

Recent ruling by California Supreme Court says any city has "inherent local police power” under the California Constitution to determine the appropriate uses of land within its jurisdiction.  That includes cell phone towers so a city (like Sunnyvale) can tell a phone co. to adhere to city zoning standards for aesthetics.

More here:

http://www.cacities.org/Top/News/News-Articles/2019/April/California-Supreme-Court-Upholds-Local-Ordinance-R

The opinion is here:

https://www.courts.ca.gov/opinions/documents/S238001.PDF


Saturday, April 6, 2019

Forum on SB-50

California Housing
Challenging the Narrative

Summary:  The current narrative is that everyone wants to walk to work (especially millennials) and we should abandon Single Family Homes (SFHs) and build only high rise apartments.  Here we look at data relating to housing prices and commuting.  We see that about half the population prefers to own a single family house and commute and the other half prefers a denser environment (townhouse and condos) and walk, bus, or bike (not drive) to work.

Link to this post (for sharing):

Discussion and Slides:

These are the PowerPoint slides and text (with a few additions) Sunnyvale Council member Michael Goldman (me) used at a Forum on California Senate Bill 50 and related "housing" bills.  The forum was held on April 6th, 2019, in Cupertino.  Also presenting were city council members Lydia Kou of Palo Alto, Julie Testa of Pleasanton, and Mayor Steven Scharf of Cupertino along with Susan Kirsch of "Livable California".  A video of the event will be available soon, as will the slides used by all participants.

Slide 1 (click image to enlarge):

SB-50 applies to transit stops and "job-rich" areas with schools with "positive outcomes".  "Job-Rich" is defined as more jobs than surrounding area.  Does Merced have more jobs than surrounding farms and fields?  Sure.  Are there any schools that do not have "positive outcomes"?  No.  So SB-50 applies everywhere.

There is no time limit or other criterion for when we will no longer be in a "housing crisis".  Without any definition of the "housing crisis" we can't tell where or for how long it exists.  If you can't define the problem then you can't know when you've solved it.  So, SB-50 will apply everywhere and forever.  In other words the "housing crisis" will never end.  If it never ends, then SB-50 isn't going to solve the "housing crisis".  Maybe it isn't intended to.

The key thing to know about SB-50 is that it is not directly intended to increase housing “affordability”.  The idea is simply to increase the construction of apartment buildings by allowing them to be constructed in residential neighborhoods.

Under SB-50, any single family home can be torn down and replaced with an apartment up to 4 or 5 stories - with a “density bonus” that’s 5-6 stories.  Near transit stops it is 5-6 stories with density bonus going to 7-9 stories.  Only 1 parking space for every 2 apartments can be required by a city or county.  That means two 2-bedroom apartments (four bedrooms total) cannot be required by the city or county to have more than one off-street parking space to share among them.  The builder may decide to build more off-street parking for higher end apartments which might not rent without more parking.  However, no jurisdiction can require it.

Slide 2 (click image to enlarge):
https://embarcaderoinstitute.com/portfolio-items/sb-50/
Text of SB-50 here: 


This applies even to areas where housing costs are low and lots of housing is being built.  Areas like Riverside and Sacramento are already “affordable” to most people and there is lots of construction. Nonetheless, SB-50 applies there as well as San Francisco or Sunnyvale.

Slide 3 (click image to enlarge):
Minneapolis grew more than Silicon Valley?  Must be the weather!
From: https://meetingthetwain.blogspot.com/2018/10/on-move-1.html
and: https://meetingthetwain.blogspot.com/2019/03/lao-on-housing.html
The story is that there is a shortage of housing units because builders are unable to keep up with tremendous growth in the SF Bay Area.  This is false.  They can keep up with much higher growth in metro areas like Charlotte and Riverside where there is plenty of buildable land.

In fact, almost 90% of the top 300 US metro areas are affordable to any family with the median income.  It is only about 10% of those metro areas that are hard for median income buyers to afford.

Slide 4 (click image to enlarge):
https://shelterforce.org/2019/02/19/whose-affordable-housing-crisis
So why are housing prices high in the SF Bay area?  Simple - there's not much land to build on and some people can afford the high prices!  Revenue per employee is $1.3M at Google, $1.6M at Facebook, $1.9M at Apple.  Their employees don't get paid that much but they get paid enough more than the average worker that they are better able to outbid others for a single family home close to work.

You cannot bring in trillions of dollars from around the world and thousands of highly paid workers (with stock options) and expect costs to not increase.  What are people thinking?

Slide 5 (click image to enlarge):
From: https://howmuch.net/articles/tech-companies-revenue-per-employee
Shortages increase costs.  But high costs don’t mean there's a shortage.  A Lexus 500 costs 5 times a Corolla but there is no shortage.  Go buy 10 of them if you have the money.

Slide 6  (click image to enlarge):
The Great "Lexus Crisis" of 2019
So why are people commuting long distances instead of living near work?  Well, half the population wants to live in a small town.

Slide 7 (click image to enlarge):
https://uli.org/wp-content/uploads/ULI-Documents/America-in-2013-Final-Report.pdf
About the above graph - I want to point out this was from a survey done for both the "Urban Land Institute" (ULI) and "National Association of Realtors" (NAR).  The ULI desperately wants to stop suburban sprawl and get everyone to live in high rises.  They keep asking the same questions year after year hoping they will get answers they want to hear.  Instead they keep getting results (like slide 8 below) that say 50% prefer a Single Family Home, driving to work and stores, instead of condo/apt. and walk to work and stores.

Slide 8 (click image to enlarge):
Random variations in sampling means you never get the same proportions year to year.
https://www.nar.realtor/sites/default/files/documents/2017%20Analysis%20and%20slides.pdf
From: https://www.nar.realtor/reports/nar-2017-community-preference-survey
This applies to all generations - including "millennials".  Of millennials, 47% prefer "large yards & drive" vs. 53% who prefer "small yard and walk".  That is - with random variations in sampling - equivalent to a 50-50 split.

Slide 9 (click image to enlarge):
The "Greatest" generation are in their 70's and older and are less likely to want to drive.
From: https://www.nar.realtor/sites/default/files/documents/2017%20Analysis%20and%20slides.pdf
More at: https://www.nar.realtor/reports/nar-2017-community-preference-survey
So, lots of people commute from single family homes in distant suburbs to areas with lots of jobs but no room for more single family homes.  And VICE-VERSA!  People change jobs on average every 5 years - they aren’t going to change houses every time they change jobs!

And this shows up in actual data.  If we look at Palo Alto (slide 10) and how many commute more than 50 miles not only TO Palo Alto but FROM Palo Alto, we see that as population increases both the number and percentage of super-commuters increases – BOTH ways!  

Slide 10 (click image to enlarge):
Palo Alto increased both the number of jobs and the number of housing units from 2002 to 2015
resulting in more "super commuters" (Both Ways) than before.  (From Census data)
More here:  https://meetingthetwain.blogspot.com/2018/01/palo-alto-work-live-commute.html
This is absolutely normal.  This is how people organize themselves around metro areas in the US.

Slide 11 (click image to enlarge):
More here:
https://meetingthetwain.blogspot.com/2018/06/commute-distance-in-us-metro-areas.html
We have been building in the SF Bay area for years and are currently at the low end of affordability but it has been worse as well as better.  Slide 12 below shows that housing affordability in California has varied from a low of 14% in 2007 to a high of 55% in 2011.  It is currently at about 28% or roughly half way between the extremes.  Similarly for Santa Clara County, 27-year range of 12% to 42%, currently at 17%.

Slide 12 (click image to enlarge):

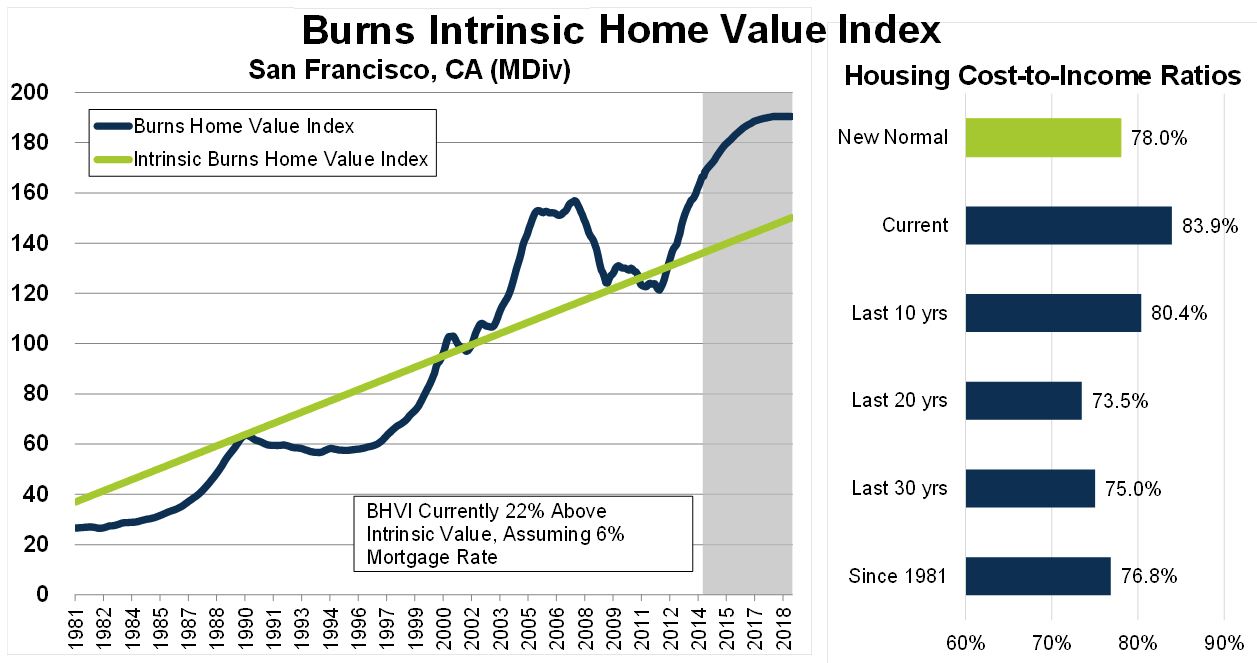
We are in the longest economic expansion in US history and it shows up in housing prices – if anything, it is a bubble not a crisis.

Slide 13 (click image to enlarge):
From John Burns Real Estate Consulting newsletter
This is projected to come back down to the trend-line by 2021 as seen in slide 14, below.

Slide 14 (click image to enlarge):
https://journal.firsttuesday.us/california-tiered-home-pricing-2/1592/
So what will happen?  "It is really hard to make predictions, especially about the future" (Yogi Berra) but two possibilities seem likely.

1.  Silicon Valley becomes like NYC with lots of tall buildings in the center and millions of commuters on mass transit (costing $Billions) - with suburbs sprawling out to Merced and Sacramento - or ...

2.  We become like LA.  We stop growing with new job centers forming in adjacent counties.  Many companies move to Texas or Washington state.  Silicon Valley population growth - already anemic at 6% below the national average - simply slows to a crawl.

Either way it gets more expensive.

Slide 15 (click image to enlarge):

For now this is....


Tuesday, March 19, 2019

CASA Opposed by Sunnyvale

Letter From Sunnyvale to MTC
(PhotoCopy)

In December of 2018 then-Mayor Glenn Hendricks wrote a letter to the then-Chairperson of MTC (Metropolitan Transportation Commission) in opposition to the "CASA Compact".  A photocopy of the letter in several images is below.  Click on any image to enlarge.

The letter is available for download from:

Link to this post for sharing is:

The letter points out that Sunnyvale has been building a lot of housing.  It goes on to point out several problems with CASA in regards to governance and taxation.

The letter shown below is a photocopy so as to include the official Sunnyvale letterhead.  Click on any part of it to enlarge it for readability.


Sunday, March 17, 2019

California SB-50 (2019) - I

The following is an edited version of a flier from Livable California.  Phone numbers and contact addresses at the end.

Web Site Here: https://www.livablecalifornia.org/

Link to this post for sharing is:
https://meetingthetwain.blogspot.com/2019/03/california-sb-50-2019-i.html

The California Legislature is considering a number of bills that affect housing.  The big one is Senate Bill 50 (SB-50).  While there are affordability issues in some parts of the state, the issue here is unregulated, profit-driven development that would be worsened by 2019 legislation.  Some have described SB-50 as not a "housing" bill but a "real estate" bill.

TIME FRAME: The bills are in their respective policy committees NOW. They must move out of committee by April 26. ACT NOW: Choose the options and frequency that work for you.

Livable CA has prioritized our efforts to oppose these bills.

SB-50 (overrides local planning) - allows anyone to put up a 4 to 5 story apartment in any residential neighborhood with either good schools, or lots of jobs, or near any form of transit - those terms to be defined at an unspecified time and by an unspecified agency.  Applies to entire state.

Text of SB-50 here:
https://leginfo.legislature.ca.gov/faces/billTextClient.xhtml?bill_id=201920200SB50

SB-330 - Restricts the ability of jurisdictions to change several parameters of residential zoning.  Jurisdictions may not lower the density or limit the number of residential units. And, most importantly, may not alter any requirements in appearance or features that would be more costly than those effective January 1, 2018.

This last point means that cities cannot require new apartments or condos to have things like cisterns to conserve water or be net-zero energy or to have solar panels above 3 stories.  Nor can cities or counties require that new housing construction be fully electric (i.e., not connected to natural gas).  This means cities can not ask for reductions in GHG emissions due to housing.

Text of SB-330 here:

AB-725 (attack on single family homes)
No more than 20% of "above moderate income" housing intended to satisfy "Regional Housing Needs Allocation" (RHNA) can be single family homes.  In other words, 80% must be apartments or condos.  The number of "above moderate income" housing units for RHNA is determined by the CA "Housing and Community Development".

Text of AB-725 here:

EMAIL or CALL your State Senator and Assembly Members about bills coming out of MTC-initiated CASA Compact, which lacked transparency and representation from 97 of 101 cities. Personally or collectively urge opposition to the bills that are an assault on local control and democratic principles. Find your state rep here: http://www.legislature.ca.gov/your_legislator.html. Follow the prompts.

EMAIL or CALL the SENATE Housing Committee.

Scott Wiener, Chair....(916) 651-4011   https://sd11.senate.ca.gov/contact
Mike Morrell, VC........(916) 651-4023....https://morrell.cssrc.us
Anna Caballero          (916) 651-4012   https://sd12.senate.ca.gov/contact
Patricia Bates..............(916) 651-4036...https://bates.cssrc.us/content/contact
Maria Elena Durazo   (916) 651-4024...https://sd24.senate.ca.gov/contact
Mike McGuire............(916) 651-4002....senator.mcguire@senate.ca.gov
John Moorlach           (916) 651-4037   https://moorlach.cssrc.us/content/my-offices
Richard Roth..............(916) 651-4031...https://sd31.senate.ca.gov/send-e-mail
Nancy Skinner           (916) 651-4009    https://sd09.senate.ca.gov/contact
Thomas Umberg........(916) 651-4034...https://sd34.senate.ca.gov/contact
Bob Wieckowski        (916) 651-4010    https://sd10.senate.ca.gov/contact/email


Tuesday, March 5, 2019

LAO on Housing - I

"A Rising Population ...
...makes competition for land fiercer, which in turn leads to an increase in land rent everywhere and pushes the urban fringe outward.  This corresponds to a well documented fact stressed by economic historians.  Examples include the growth of cities in Europe in the 12th and 19th centuries as well as in North America and Japan in the 20th century or since the 1960s in Third World countries."
(From page 83, section 3.3.2: Economics of Agglomeration:... by Fujita, Thisse).
Florence, Italy in 1493
https://commons.wikimedia.org/wiki/File:Florence1493.png
(link to this post for sharing:
 https://meetingthetwain.blogspot.com/2019/03/lao-on-housing.html )

A 2 page condensed version in Word is available here:
https://drive.google.com/file/d/1vMS2rTnFmL3DCf-Sgrbb9VPYwpPW1sw6/view?usp=sharing

Precis:

California's oft-stated 3.5 million housing "shortage" does not exist.  The plans of Governor Newsom and others to fill that non-existent "shortage" will reallocate needed housing funds from the poorest groups and areas to the more affluent population.

That 3.5 million number is a mis-interpretation of the Legislative Analyst Office's (LAO) 2015 report on housing.  The LAO argues that if there had been 3.5 million more housing units built over 1980-2015 then housing costs would have been lower.  If housing costs were lower, they hypothesize, more people would have moved to California to fill those 3.5 million housing units.  Those who hypothetically might have moved to California did not move here then so they are not here now - hence, no shortage.

They might not have moved to California anyway because during those 35 years there were recessions, lay-offs, etc. in the US and California.  A California company goes on a hiring spree for a while and people move to California for the new jobs.  Housing prices rise during the hiring spree.  Then as markets cool, it stops hiring so people stop moving in.  The LAO is reversing "cause and effect" assuming people would always move to California at a steady pace regardless of all other economic conditions.

If (magically) 3.5 million new homes (a 25% increase of the existing stock) were to appear in California they would be empty and remain so.  California has seen a net loss of native population through domestic out-migration for many years.  In-migration from other countries has masked this - until now.

Perhaps through a misunderstanding of HCD's "Regional Housing Needs Allocation" (RHNA) numbers there is a view that there is a "housing crisis".  RHNA numbers are planning for potential growth.  If the growth does not happen, those numbers mean nothing. They are not requirements. Thirteen rural CA counties lost population.  They did not “make their RHNA numbers” because there was no need for new housing.  That does not constitute a “crisis”.  We are currently in a housing bubble similar to that of 2008 which will not last much longer.  Cf, https://meetingthetwain.blogspot.com/2018/09/ree-diculous-ree-na-part-i.html

The LAO advocates increasing density in the already densest, most geographically constrained job centers.  This ignores the most essential tenet of "Urban Economics" going back centuries - "increased density increases the cost of housing".  If increased density lowered the cost of housing, then Lower Manhattan and Hong Kong would be the cheapest places in the world.  They aren't.

The LAO's prescription for lowering housing costs by building more densely in already dense areas will actually raise housing costs.  That, in fact, is what is happening and has been happening for decades.  More density, more traffic, and housing prices increase.
Silicon Valley has been increasing housing since it's beginning and the prices keep rising.
So we should build more housing to make prices go down!
We see it everywhere - gentrification and displacement.  It has caused increasing out-migration of companies and population who cannot afford the increased prices or cannot stand the increased traffic.

The obvious alternative is to direct business expansion (and thus population increase) to the less dense metro areas in California with more buildable land such as Sacramento and Riverside.  The population growth is naturally happening there, anyway.

Introduction:

Governor Newsom has proposed some re-allocations of state funds for housing.  The Legislative Analyst Office's (LAO) looks at those proposals in "The 2019-2020 Budget: Considerations for the Governor’s Housing Plan" (CGHP) by Gabriel Patek dated February 2019 available at: https://lao.ca.gov/Publications/Detail/3941
Considerations for the Governor's Housing Plan - CGHP
https://lao.ca.gov/Publications/Detail/3941
As CGHP refers to the 2015 LAO document "California’s High Housing Costs: Causes and Consequences" (CHHC) we also address the references and conclusions from that document available at: https://lao.ca.gov/reports/2015/finance/housing-costs/housing-costs.aspx

California’s High Housing Costs: Causes and Consequences" (CHHC)
https://lao.ca.gov/reports/2015/finance/housing-costs/housing-costs.aspx
This post is an analysis of the above two documents.

Summary of LAO Documents:

The CGHP (2019) focuses on Governor Newsom's stated strategic concepts on housing .

In particular, discussion centers on the proposed allocation of more state funds for middle class residents.  The LAO is essentially arguing that if more state money is allocated to housing for middle income housing then there will be less for the lowest income.  They appear to argue that since it is the lowest income group that suffers most from high housing costs, funds should then continue to be directed to those groups.  In addition, I would add that the highest housing costs are in the highest income areas (not unrelated facts).  Sending more state money to the highest cost areas would be a transfer of wealth from all areas - including the poorest - to the richest areas.

However, the LAO continues on with an argument they have advanced for years that the cause of California's high housing costs (relative to the US average) is a failure to build enough housing in dense urban areas along the coasts.  The LAO also argues that it is necessary to increase density to lower housing costs.  This contradicts basic theories of "Urban Economics" going back hundreds of years as taught in popular Urban Economics texts both undergraduate and graduate as well as countless academic papers.  No specialist in Urban Economics disputes that increased density increases housing prices.

Analysis:

There are 3 points:

Point 1.  A "Shortage" of housing units is not the prime cause of high housing-cost-burdens.
Point 2:  More "Housing Units per Household" Does NOT Correlate with Affordability.
Point 3:  LAO's statistical model is flawed.


Point 1.  A "Shortage" of housing units is not the prime cause of high housing-cost-burdens.

Figure 1 in CGHP (below) is comparing California - a state dominated by a few highly urbanized metro areas - with the entire US.

Figure 1

Comparing California with the entire country includes North Dakota, West Virginia and many other rural and semi-rural states.  Such a comparison renders the graph almost meaningless.  Comparing urban areas in California to other major urban areas on a housing-cost-stressed metric is far better.  This is done in the following graph from U. of Southern California (via Slate).  This graph shows that it is not the cost of housing but the incomes which are the determining factors in cost burdens.

Figure 2: (click to enlarge)
LA, Riverside, San Diego on left of "West" group.  San Jose & SF-Oak. on right of "West" group.
https://slate.com/business/2018/10/rental-affordability-metric-complicated.html
This is important in examining LAO's thesis that California communities have restricted housing and that is the reason prices are high.  In figure 2, above, the US Census' "SF-Oakland" metro area is near the low end of "cost-burdened" metro areas in the "West" group even though housing prices there are the highest in the US in absolute dollar terms - as are salaries (hint, hint).

Continuing with figure 2, renters in the communities in other metro areas such as Miami, New Orleans, and Orlando are cost-burdened as much as, or even more than, the California coastal cities (left bars under "West").  It is hard to argue that Miami and Orlando have restricted housing construction.  One of Florida's main industries is constructing housing for new Floridians.

Figure 2, above, shows Cleveland as having the most cost-burdened renters in the Midwest yet Cleveland's housing costs are some of the lowest in the country in absolute dollar terms.  Cleveland's population during the period 2000-2017 actually declined 4.2%.  Cleveland thus has a surplus of housing.

A Harvard study considers "residual income" - what is left over after the rent is paid.  For example, a couple making $300,000/year could pay 50% of their income for housing and have a $150,000 "residual" - more than enough for other expenses.  On the other hand, a couple paying 30% of a $30,000/year income would struggle to get by with a "residual" of $20,000/year.  The standard 30% criterion for housing costs does not consider that and should only be used for the lowest income quintiles.  (Harvard paper here:
https://www.jchs.harvard.edu/sites/default/files/Harvard_JCHS_Herbert_Hermann_McCue_measuring_housing_affordability.pdf)

When you correct for "residual income", as the Harvard study shows, the difference between LA and Cleveland for lower income households diminishes to only 4% for a family of four.

The following bar chart (Figure 3) shows California is one of the top five states for housing costs as a percentage of income.  Florida and Hawaii are slightly higher.  Louisiana and New Jersey are slightly worse.

Figure 3: (click to enlarge)
Florida, Hawaii, California, Louisiana, and New Jersey the top 5 states in percent of income spent on rent.
California is in the red box.  Source:
https://overflow.solutions/demographic-data/what-percentage-of-household-income-is-spent-on-rent-in-each-state/
SF-Oakland metro area less "Cost-Burdened" than Orlando or Las Vegas?  California less cost-burdened than Florida?  Clearly the LAO is wrong in their assertion that the reason for "California’s high housing costs, ...is the significant shortage of housing..." page 1 of CGHP (2019).  We cannot argue against their evidence for that statement since they offer none.  Building more housing is not valid as a way to help cost-burdened households.  Other factors need to be considered.


Point 2: More "Housing per Household" Does NOT Correlate with Affordability.

From the US Census' "Quick Facts" (link below) we see that the US has over 137.4 million housing units for 118.8 million households for an average = 1.16 housing units per household (HupH).  This includes vacation homes, housing in transition, apartment vacancies, etc.  That is 11.6 housing units for every 10 households.

California has 14.2 million housing units for 12.9 million households = 1.10 HupH.  That is 11 housing units for every 10 households.  For California to reach the national average of 1.16 it would need only about 5.5% more housing units or 773,600 additional housing units.

Building 3.5 million more homes as Governor Newsom has pledged to do is an astonishing prescription.  If an additional 3.5 million housing units were added, the result would be a ratio of 1.37 HupH - almost 14 housing units for each 10 households - far higher than any other state. The following graph, figure 4, shows where California is now and would be under other scenarios:

Figure 4: (click to enlarge)

Data from US Census's "Quick Facts" eg,
https://www.census.gov/quickfacts/fact/table/hi,ny,fl,tx,ca,US/HSG010217#HSG010217
Only 5 states, cities, etc. available at a time.  Delete one to add another.
California (green bar) is the lowest in HupH at 1.10 but not by much.  A 5.5% increase in housing would bring it to the national average (purple bar) while 3.5M more homes would put it way above all other states - the top orange bar.  None of this matters because when we compare these housing-to-household ratios in figure 4 (above) with housing prices in figure 5 (below) we see no correlation between "housing units per population" and home price.

Figure 5 (click image to enlarge):

Data from US Census's "Quick Facts" eg,
https://www.census.gov/quickfacts/fact/table/hi,ny,fl,tx,ca,US/HSG010217#HSG010217
Affordability (as measured by "rent-burdened households") has no obvious correlation with "Housing Units Per Household".  Florida has low cost housing and very high Housing Units Per Household ratios.  Nonetheless, Florida's population is the most rent-burdened in the country.  Hawaii has more expensive housing than California yet has a higher HupH ratio than the national average.  It is hard to argue, as the LAO does, that housing supply is the principal factor in cost burdens.


Point 3:  LAO's statistical model is flawed.

The LAO model is described in the "Technical Appendix" at the end of CHPC (2015).  In the PDF version it starts on page 36.  The LAO's model concludes that if an additional 100,000 homes per year had been built, that would have kept housing costs lower and more people would have come to California, enough to fill 3.5 million homes.

We see this in the CGHP (2019) report in the grey box on the bottom of page 2:
---
"This suggests an aggregate of about 3 million additional housing units would have been needed between 1980 and 2010 to keep California’s housing cost growth in line with cost escalations elsewhere in the nation."
---
This is further elaborated on in CHPC (2015, top of page 4) stating that an additional 100,000 units per year would need to be added to mitigate housing costs.  This would add another 500,000 units during 2011-2015 for a total of 3.5 million by 2015.

There are several problems with their model and interpretation.

Problem 1: The most glaring is that it starts with the assumption that people will come to California at the same rate limited solely by housing costs.  What we see in actual data is that California's growth rate is highly variable and is declining as is the US's as shown in the graph below:
https://journal.firsttuesday.us/rateofpopulationgrowth/1306/
This assumption of constant growth rate is also part of their conclusion - that more people would have come to California if it were not for the high housing costs.  Basing your model on the assumption you wish to prove will always prove your assumption.

Problem 2: Even if that model were correct, it is still incorrect to say (as many have been saying), that there is currently a shortage of 3.5 million housing units.  Those that (hypothetically) would have come to fill the 3.5 million housing units (that didn't get built) would have since gone elsewhere - which they might have done anyway!  Housing is currently in approximate balance with population as shown previously.

Problem 3:  As mentioned in the beginning, the field of "Urban Economics" has shown repeatedly that increased density increases housing costs.  The figure below illu

Land further from major employment areas is less costly and so then is the housing.
From Paper "Spatial Distribution of Land Prices and Densities - The Models Developed by Economists"
http://marroninstitute.nyu.edu/content/working-papers/the-spatial-distribution-of-land-prices-and-densities
A paper (2015) by Alain Bertaud at the Marron Institute of Urban Management at NYU discusses this.  He previously held the position of principal urban planner at the World Bank. His paper is available at:
http://marroninstitute.nyu.edu/content/working-papers/the-spatial-distribution-of-land-prices-and-densities

Much more on the costs of housing vs. density here:
https://meetingthetwain.blogspot.com/2017/01/live-work-commute-2.html

Development in the SF Bay Area is limited by the decisions (which I support) to not fill in the Bay and to protect open areas surrounding the populated areas.  Without these restrictions, more land would have been available to build on and prices and density would have been lower.  But, the SF Bay Area would then be immeasurably less attractive and, without the cooling effect of the bay, much hotter.

Excluding surrounding open space from development also limits the amount of land that can be built on.  The cost of remaining land is made more valuable because of it's resulting limited supply due to the restrictions on development in and around the bay.  This is seen in figure 6 below:

Figure 6:
The curves below show that as the distance, X, from the center of a metro area decreases the cost of land increases.  Reducing the available land raises the cost curve at all distances.

Cost vs. Density Curve
Cost vs. Density Curve from page 74 of "Lectures on Urban Economics" by Brueckner, 2011, MIT Press
Due to urban growth boundaries, "the resulting city has smaller dwellings and is more expensive to live in."
People who want larger dwellings at less cost will leave such areas.
This same cost vs. density "isoquant" curve is seen throughout basic Urban Economics. A standard undergraduate textbook used at UC-Berkeley is "Lectures on Urban Economics" by Brueckner. He points this out very well as shown in figure 6 above.

Brueckner is examining the effect of politically instituted "Urban Growth Boundaries" but the conclusion is the same whether the boundaries are imposed by laws or by geography.  This is stated by Brueckner as "in the presence of an open-space amenity, the socially optimal city is spatially smaller than the city generated by the free-market equilibrium."  ("Socially optimal" because the unfilled-in bay and the undeveloped open space are "social" goods making life "optimal".)

"Socially Optimal"
Golden Gate Park in San Francisco
Not "Socially Optimal"
Since less space is available, the space that is available becomes more valuable.  Dwellings become smaller to fit people into the remaining space.  Compare housing in Lower Manhattan with that in Peoria, Illinois.

This goes back to the "Law of Rent" from David Ricardo (1772 - 1823), and "Spatial Economics and Economic Geography" of Johann Heinrich von Thünen (1783 - 1850) as described in many, many, many economics texts, papers and (of course) Wikipedia.

Problem 4:  The implicit assumption of the LAO is that urban areas can expand indefinitely. This flies in the face of many decades of economic theory and thousands of academic studies on "Optimal City Size" in Urban Economics.  Optimal city size is described as:
----------
"Theories on the optimal city size indicate that, when a city has an optimal population size, the forces of agglomeration economies are offset by the forces of disagglomeration economies, resulting in locally constant returns to scale".  (from "The Optimal Size of German Cities An Efficiency Analysis Perspective" by Stephan Hitzschke -
https://www.researchgate.net/publication/254403140_The_Optimal_Size_of_German_Cities_An_Efficiency_Analysis_Perspective )
----------

In simple terms, the above states that a city reaches its optimal size when the advantages of a big city equal the disadvantages.  Further growth after that is not possible.  A standard Urban Economics textbook (used at UCLA) shows this in the following graph:

Figure 7:

From "Urban Economics", 8th edition, by O'Sullivan
The cost of density rises slowly at first but at a certain point overcomes the advantages of density.
This is the equilibrium point when a city cannot grow without life deteriorating.
Where the lines of "cost" vs. "return" cross is the "equilibrium point".  At that point, the number of people who come for the advantages of big city life (better paying jobs, more opportunity, more cultural events) equals the number of people who leave because they can't stand it any more - traffic is too bad, taxes are too high, housing costs too much - life is too stressful. 

The cost of more bridges, highways, subways, etc., etc., starts to exceed the economic benefit of being in a big city.  The City has then reached it's "optimal size" and further growth relative to the population of the nation as a whole is very difficult.

Hence LA  metro area grew 8% from 2000-2017 while Charlotte grew 90%, Austin grew 69%, and Minneapolis grew 21% in the same time period.  See figure 7.

Figure 8: Click image to enlarge.
Top 50 Metro Areas population over 1 million grew 21% on average.
Only less dense areas in California exceeded that.
Data from US Census year 2000 and ACS 2017
More housing in the LA or the SF Bay areas will drive up rents, increase traffic, increase urban sprawl, require massive investment in new bridges, tunnels and freeways, requiring increased taxes.

For example - the Golden Gate Bridge has been at capacity for over a decade.  Further development in Marin County will either make the bridge impassable or require a second bridge or tunnel costing billions of dollars and increased taxes. Similarly for other parts of the SF Bay Area.

This will continue to drive corporations and individuals to other states.  Other people will come to replace those that left and at some point there will be equilibrium when the number of people entering California equals the number leaving - probably preceded by net population loss.

SF Bay Area with 50 Mile Radius around Silicon Valley
Geographically Constrained - Therefore Expensive
Houston with 50 Mile Radius around Center
NOT Geographically Constrained - Therefore Cheaper
If there is to be further growth in California it must come where there is space to expand and build the single family homes that most people desire. Sacramento and Riverside are seeing that growth already. Further state efforts at development, in order to succeed, must go where people desire to move.

What Not to Do:

As mentioned earlier, there is a net outflow of domestic residents from California.  See color-coded map from Harvard's "Joint Center for Housing Studies" (Figure 6) below:

Figure 9:  
Net Flow of Domestic Moves Between States.  
Red is "net Outflow".  Blue is "net Inflow".
Big states losing population.
https://www.jchs.harvard.edu/blog/not-just-the-sunbelt-millennials-and-baby-boomers-increasingly-head-west/
It is only foreign immigration that keeps California's population growing.  If that immigration slows down, stops, or reverses (as it has for Latino immigrants) that outflow will lead to a surplus of housing.  State expenditures for middle class housing will be wasted.

Governor Newsom apparently campaigned on the LAO model of a 3.5 million housing deficit.  It may guide his thinking on housing budgets.  Other politicians have used that same 3.5 million to describe a shortage of crisis proportions.  But there are not 3.5 million households without housing.

This imagined "housing shortage" is being used to justify the anti-democratic over-riding of local control.  It is also being used to justify increased taxes, and building on open space and parks.  This increases congestion, and a feeling of being overwhelmed.  It is not healthy.  This lowered quality of life is increasing out-migration.

At $500,000 per housing unit, 3.5 million housing units is $1.75 Trillion!  For comparison, California's GDP is $2.9 Trillion.  That is a tremendous amount of money to satisfy a demand which does not exist now and may never have existed outside of the LAO statistical assumptions.

In thanking academics and others who helped them with their model, the authors of CHPC (2015) note that not everyone agreed with their conclusions.  It would have been nice to see the dissenting views in the report.


LAO Documentation Standards
(or lack thereof)

Throughout these two LAO documents and similar ones on housing, there are no sources given for any of the data.  No calculations are shown.  No references for economic theory justifying the assertions.

From the University of Colorado, Boulder:

"You must acknowledge the sources of all your information and any ideas or interpretations you have taken from other works...references are usually placed into notes, with a bibliography at the end of the paper that lists all works used" 

Above from Part D of:

The LAO document authors follow none of the above guidelines.

We are not talking about academic peer-reviewed research papers - just an ordinary paper attempting to summarize complex situations for executives with busy schedules looking for informative guidance.  Such documents need sources, references and supporting economic theory so they can be verified and serve as a starting point for further investigation.  Without reference to those sources and dissenting opinions those topics cannot be further examined for nuance or error.

Conclusion:

The LAO has produced documents with claims deriving from fundamentally flawed models that ignore the long established tenets and observed results of centuries of economic research.  As a result politicians have taken these hypothetical and counter-factual theses to advocate and budget for seriously misguided policies - policies which will only make things worse for Californians.  This will cause more people to leave for states which actually listen to what residents want rather than what developers want.

For now this is...