On a local level we have a large supply of commercial office space in some parts of Silicon Valley, though it varies from city to city. A recent article titled
"Silicon Valley is becoming a commercial real estate disaster"
in the business journal BusinessInsider raises some question as to the reasons for building more office space. http://www.businessinsider.com/silicon-valley-is-becoming-a-commercial-real-estate-disaster-2017-7 Although some parts of Silicon Valley have high demand for commercial office space, other cities have a four-year to eight-year supply. Charts below show this clearly. (click on any one to enlarge).
Millions of sq. ft. of office space available (red-blue line) and not much being leased (beige line).

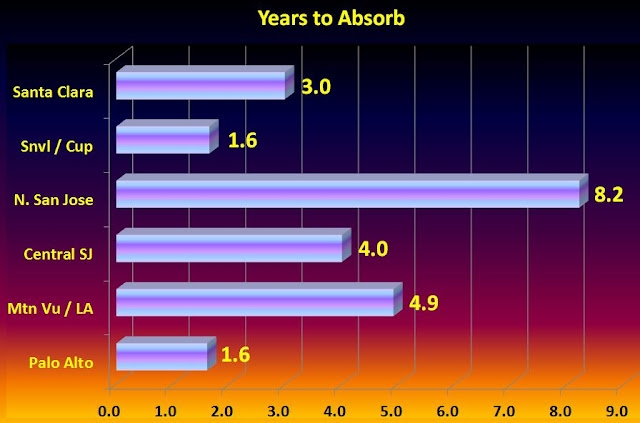
In terms of how many years it would take to absorb all this office space divide the SF available for lease with the lease rate. Results shown below.
The total available is seen in the next graph. The amount available for lease is a large fraction of the total space (leased and available) - 30% in North San Jose.

Local employment seems to be weakening. That and the future expansion of Apple and Google office needs to San Jose, suggest skepticism about further office development in the northern part of Silicon Valley. (click graph to enlarge).

Before we get to far into local stuff, let's take a quick look at national trends since they affect Silicon Valley and the SF Bay Metro Area.
Detail:
In terms of how many years it would take to absorb all this office space divide the SF available for lease with the lease rate. Results shown below.

The total available is seen in the next graph. The amount available for lease is a large fraction of the total space (leased and available) - 30% in North San Jose.

Local employment seems to be weakening. That and the future expansion of Apple and Google office needs to San Jose, suggest skepticism about further office development in the northern part of Silicon Valley. (click graph to enlarge).

Detail:
On a national basis, we have 'interesting' articles such as -
"Vultures Begin to Circle Commercial Real Estate"

Some excerpts -
“There’s a drop coming just like when you get to the top of a roller coaster,” said Michael Shah, chief executive of Delshah Capital, which is planning to raise a $200 million fund to focus on distressed opportunities."
 |
| Steinway Building in NYC - Not built yet but already "distressed" |
"Some developers who broke ground a few years ago when markets were booming are now running into problems because costs or sales aren’t living up to projections."

In fact it looks like we have exceeded the 2007 bubble peak substantially in $ terms (blue line in graph below). Even adjusting for inflation (dashed red line below) we are above that bubble level.


The rise in real estate rents looks very much like a repeat of the 2007 bubble and seems widespread across four major types - apartment, office, industrial, and retail as seen below:
 |
| Indices in graph above are adjusted for inflation. |
From Boston Federal Reserve we see that prices for commercial space is the highest since at least 1975.
| https://www.bostonfed.org/news-and-events/speeches/2017/financial-stability-the-role-of-real-estate-values.aspx |
While at the same time, commercial bankruptcies increase. (click on chart to enlarge).

But what about Us!?
The health of commercial office space in Silicon Valley is well studied on a frequent basis since a lot of money is involved. It is of special interest in terms of Sunnyvale's plans for downtown and El Camino Real.
In the chart below, we see employment growth slowing in a trajectory that suggests net reductions in employment may be coming. The blue bars show total employment, the green line shows the change in Silicon Valley employment, and the red dashed lines show the US change in employment. The key point is that the rate of increase in Silicon Valley employment is declining, looks like it will hit zero, and perhaps go negative (= job loss). (click on chart to enlarge)
In the chart below, we see employment growth slowing in a trajectory that suggests net reductions in employment may be coming. The blue bars show total employment, the green line shows the change in Silicon Valley employment, and the red dashed lines show the US change in employment. The key point is that the rate of increase in Silicon Valley employment is declining, looks like it will hit zero, and perhaps go negative (= job loss). (click on chart to enlarge)
 |
| Silicon Valley Employment - From Bureau of Labor Statistics via Savills-Studley |

North San Jose has enormous availability. Sunnyvale/Cupertino not too much, but Santa Clara has a lot of available space. Santa Clara is an easy bike ride from Sunnyvale/Cupertino so we might expect some contagion. In addition, we need to consider what the effect on existing Sunnyvale and Cupertino commercial space will be once Apple opens up their new 2,800,000 sq. ft. headquarters for 12,000 employees. One assumes that as leases expire, Apple will be moving more and more people into that.
 |
| 2.8 Million sq. ft. - 12,000 employees |

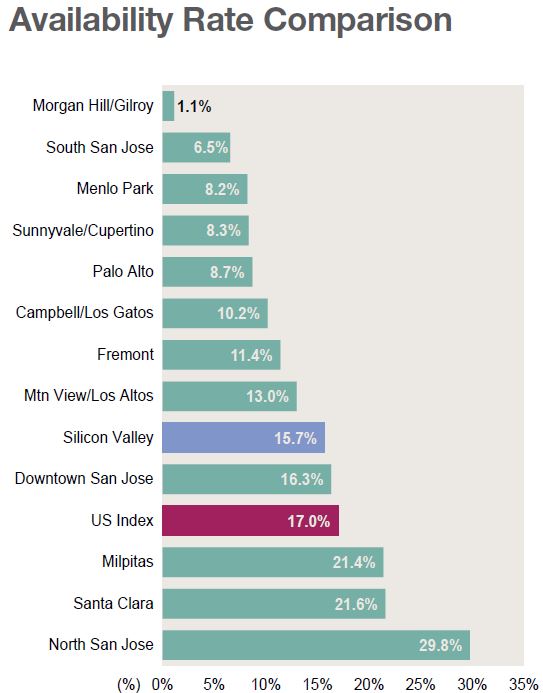
Availability rates are shown below from a detailed analysis of Silicon Valley by Savills-Studley. It shows Silicon Valley as a whole is doing better than the US average of empty offices but North San Jose has the equivalent of nearly 1 building in every 3 empty, Santa Clara and Milpitas over 1 in every 5 empty. One can't help but wonder why there is so much building in the North valley when there is so much office space available in San Jose which is closer to where most people live.
Office Rent$:
The next graph shows $ rent/sq. ft. Naturally, office rents are generally (not universally) lower where the office vacancy is higher. Most Silicon Valley towns have rents well above US average office rates. On the one hand this is a sign of a healthy market, on the other hand it means that companies under financial stress have another reason to leave the SF Bay area. Note that the highest rents are in the hardest to get to areas, least served by mass transit or highways because they are bounded by the Bay on one side and the Santa Cruz Mountain foothills on the other. Apparently, many companies are so flush with cash they can afford to pay much higher rents in the more expensive areas. This makes commutes worse for the majority of workers who can't afford to live there and don't live near a corporate bus route or for a company that provides corporate buses, |
| $ Per Sq. Ft of Office Space |
As a little side note, one thing that jumps out at you is that office rents in Menlo Park and Palo Alto are roughly three-and-a-half to four times higher than those in right-across-the-bay Fremont. Apparently Facebook, et al. are willing to pay a lot extra to make sure their engineers have the joys of commuting across the narrow bridge. (click graph to enlarge)

Should there be a recession, there will be movement towards cheaper office rents and availability rates. This would result in companies moving to less expensive Santa Clara and San Jose from Mountain View and Sunnyvale. The difference between class A space and class B and C is largely appearance. Class A has large impressive lobbies, high (hard to heat and cool) ceilings - and lots of room for cubicles or "open office" space. Class A space gets vacated quickly when the economy turns down as companies look for class B or C space.
Projections of office-using job growth shows San Francisco metro area down a little from the middle of the pack - slightly below Boston and Seattle, and slightly above Orlando and Detroit.
From Are We Overbuilding "Tier-2 cities will emerge as the new growth leaders in the cycle as businesses expand into markets where workers are easier to find and less expensive to hire."
 |
| From Cushman and Wakefield's "Are We Overbuilding?" |
A quarterly report from Colliers International for Silicon Valley shows a detailed breakdown of office space availability as seen in the chart below. The graph below shows office "availability" (= % of office space available to lease) rising in all key Silicon Valley cities for the first time in years. It is still pretty low in Sunnyvale but the trend is the wrong direction for further expansion (click graph to enlarge):

from http://www.colliers.com/~/media/Files/MarketResearch/UnitedStates/MARKETS/San%20Jose-Silicon%20Valley/sjc.all.news.Q4-16.pdf
This sub-set of Silicon Valley commercial space shows a net negative absorption of space - meaning more became available than was absorbed - for the first time in years as the amount of R&D space available grew. Simply put - R&D office space Availability (Vacancy) is UP, Absorption is DOWN

Other types of commercial space were both up and down depending on the type. In one type, Sunnyvale did quite well, stemming from Google's deal a few years ago for some office space in N. Sunnyvale
Some suggest that Chinese conglomerates have been investing unwisely and creating a real estate bubble. The Chinese government has been successfully putting a halt to some of that, but it comes at a time when the commercial real estate market is already weakening. Asia (mostly China) has become a much bigger investor in US commercial real estate than in previous years. That is tapering off now. (click on chart below to enlarge - dark blue is Asia):

"...China’s big property acquisitions are likely to get much scarcer, with US and European banks less eager to lend to Chinese conglomerates; with Chinese banks under pressure to reduce their vast exposure to the conglomerates and their precarious deals at peak prices; and with Chinese authorities determined to stem the capital outflows. And this could hit the already wheezing commercial real estate bubble in the US at the worst possible moment."
https://wolfstreet.com/2017/08/08/this-hits-the-wheezing-commercial-real-estate-bubble-at-worst-possible-time/
As a result, we are seeing a noticeable decrease in average leasing prices across Silicon Valley for the first time since 2011 - and a bigger drop than at that time. (click image to enlarge).

The immediate future is turning negative:
"...we are likely to experience an increase in vacancy and availability rates during 2017. Colliers is forecasting that the office availability rate will increase to 14.5 percent by year-end, a significant uptick from the 10.6 percent availability rate we opened the year with." (from Collier's, ibid)
Venture capital investment in new companies is decreasing:
"Mid-stage companies are struggling to raise B/C rounds. Many late-stage firms are delaying IPOs and some are taking on debt from private equity rather than face a down round. According to VentureBeat, investors placed $16.5 billion into 1,797 startups during the first quarter of this year, below the $18.7 billion placed in 2,366 startups in the first quarter of 2016. Companies that cannot raise funds are delaying expansion plans". From Savills-Studley, ibid.
How Much Office Space?
The Savills-Studley report shows that Santa Clara has the most office space at 14.3 million sq. ft., followed closely by Sunnyvale-Cupertino at 13.9 million sf. Central San Jose and North San Jose combined have a total of 21.3 million sq.ft. but those two locations in San Jose are considered separate job centers. See chart. (click chart to enlarge):
More interesting is who has the most available? That is expressed in the following chart which shows how much is available (dark bars) and how much was leased in the last 12 months (light bars). This makes it pretty obvious that not much office space is being leased and there is a lot available. As mentioned above, Colliers predicts availability will increase substantially over the next year.

To see this in perspective, here's a graph showing how long it would take at current rates to soak up all the currently available office space if no more office space is built.
 |
| How many years to absorb all the office space now available at current rates |

We also need to consider that the one of the longest economic expansions in the history of the US may be coming to an end. If that happens, we hope for a "soft landing". It is starting to look a lot like the 2000 dot-com bubble. (click chart to enlarge)
 |
| See also - http://meetingthetwain.blogspot.com/2017/08/another-financial-bubble.html |
Conclusion:
Google and Apple are planning expansion in and near downtown San Jose. They are doing this because traffic is making it impossible to hire not only more engineers but support staff - personnel, accounting, maintenance, etc., etc.. In light of this we have to ask - is it wise to build more office space in north Silicon Valley - especially in the face of a possible recession?Addendum:
For those really curious about the details of office space in Silicon Valley, below is the complete table from the Savills-Studley report, including Campbell, Morgan Hill, etc. (from: http://www.savills-studley.com/research/silicon-valley-office-market-report-2q17.pdf ) Click on table to enlarge.