Summary:
In plain English this exercise shows that the best location for a business is in the center of a populated area. This is examined in terms of commuting and in terms of business having access to human resources.
1: Modeling a populated area as a circle, I show that in a very simple model it requires about 45% more vehicle miles for everyone to commute to an edge city instead of to the center.
2: I show that 80% of the population has a longer commute if the employment center is on the edge of the populated area instead of in the center.
3: I show that 60% of the population has an unacceptable commute if they have to commute to an edge city than if they can commute to the center of the urban area
In summary, people need to commute 45% more miles, 80% have to commute further, and 60% much, much further to employment on the edge of the area than to the center.
This is theoretical math at high school level geometry. I am doing it in order to set a rigorous basis for why the logical place to develop a business is in the center of a populated areas. This jibes quite well with Alonso's modern interpretation of von Thunen's explanation of spatial layouts of cities. This will later be compared to census data to determine how close to reality it is.
Part 1: Infrastructure and VMT
I show that in a simple model of a populated area, Vehicle Miles Traveled (VMT) is 45% higher if everyone has to commute to the edge of the area instead of the center.
First we consider the simplest geometry of an urban area - a circle of radius 10 miles with all the jobs in the center of the metropolitan area. For reference, 10 miles 'as-the-crow-flies' is the distance from Apple Headquarters to downtown San Jose. If we consider 5 people, one each at N, E, S, W, and C - shown below as graphic "A" - then C commutes not at all, and each of the other four commute 10 miles each for a total Vehicle Miles Traveled (VMT) of 4 people x 10 miles each = 40 VMT.
 |
| Diagram 1 |
Now consider "B" - the extreme case where all the jobs are located at one location on the edge at "S". Now N has to commute 20 miles, C commutes 10, E and W commute 14 miles each for a total of 58 VMT vs the centrally located job center with 40 VMT - 18 more VMT for the edge job center in diagram "B". This is 18/40 = 45% more VMT. (The 14 miles for "E" and "W" is from Pythagoras' theorem: SQRT(10^2 + 10^2) = 14.1)
 |
| Diagram 2 |
...45% more traffic,

...45% more pollution,

...45% more Green House Gas emissions,

...45% more infrastructure,

Part 2: People's Commuting Distance
I show that 80% of the population in our model urban area has a shorter commute if they commute to the center of the populated area than if they commute to the edge.
We just considered urban commutes from an infrastructure point. Now we look at it from the point of view of commuters. See diagram below.
A Don't Care" line is shown in purple. Anyone living on that line is equally distant from the center "C" and the bottom edge point "S". They don't care if they go north to the center "C" or south to the edge at "S".
In the middle of the "Don't Care" line they are 5 miles from each job center. At the end of the "Don't Care" line at "SE" they are 10 miles from both "C" and "S".
Everyone in the green area is closer to the center "C" than to the edge point "S". It turns out that the green area is 80% of the total area (80.38% to be exact).
To prove this takes a little high school level geometry which I put at the end for those interested. It is in the section titled "Proof of Diagram 3".
 |
| Diagram 3 |
In the context of Silicon Valley, that means places like Cupertino, Mountain View, and Sunnyvale are good places for small start-ups but once they reach a certain point, they will be nicest to their employees, the environment, and infrastructure in commute terms by expanding in the center.
Part 3: Company Hiring Area
Suppose employees set a limit to their commute of 10 miles. They don't mind commuting 10 miles or less but they won't take a job if the commute is more than 10 miles (defined as unacceptable).
Clearly if jobs are located in the center of the 10-mile radius circle, 100% of the population is just fine with the commute. No diagram for that.
If the company is on the edge, we have the case in the diagram below. It turns out that 60% (61% actually, but let's keep it simple) of those living in the circle are not going to commute to "S" because it is too far.
The math here is basic HS geometry I put it at the end in the section titled "Proof of Diagram 4" to avoid distractions.
 |
| Diagram 4 |
From the point of view of hiring talent, a company locating at "S" has cut itself off from 60% of the population in that situation where a 10 mile (radius of the circle) commute is considered an acceptable limit. Alternatively, it has imposed a commuting burden on 60% of the population that is above what they would have if the business were located in the center. Why would any responsible business do that?
Not everyone will set a hard and fast limit at 10 miles commuting. Some will set a lower limit, some a higher, and it will vary depending on the characteristics of the job, but clearly it is to the advantage of the company to locate close to the center to have the least commute for the greatest number of potential employees.
This depends, of course, on how big the populated area is and how busy a commute it is. In a smaller community or more spread out community, where freeways, buses, subways etc. are all fast and easy, it is a mind over matter situation - "if you don't mind, it doesn't matter".
That is not the case in the case of Silicon Valley where only 4% can commute by public bus, and the freeways are clogged pretty much all the time.
Begin Math Proofs
Proof of Diagram 3
The following diagram is a bit 'busy' but it contains all the elements. I am assuming knowledge of HS geometry. I can't teach that in a blog post so find a HS kid to help you if you forgot your geometry.
 | |
|
 | |
|
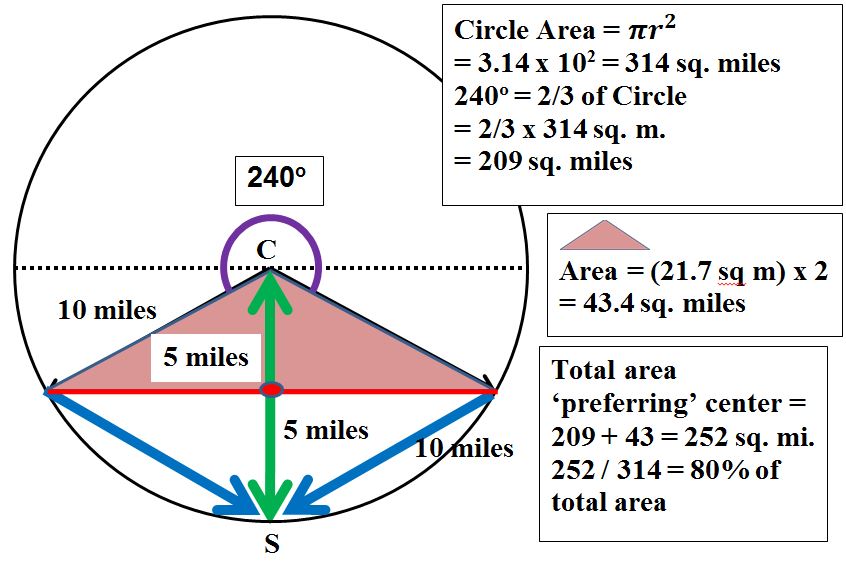
In the blue triangle in diagram 6 we show half the pink triangle in diagram 5. The height is 5 miles, the hypotenuse is 10 miles, so by Pythagoras, the base is 5 x SQRT(3) = 8.7 miles. The area of the triangle is then Base x Height / 2 = 21.7 sq. miles. We double this to get the are of the entire pink triangle of Diagram 5 = 43.4 sq. mi. Using Arcsin(5 miles /10 miles) = 30 degrees we find the top angle is 60 deg. so the entire pink triangle subtends an arc of 120 deg. This means the remaining part of the circle is 240 deg. or 2/3 of a circle. The radius of the circle is 10 miles so the entire circle is of area 314 sq. mi. as shown in diagram 5. Now 2/3 of that is 209 sq. mi. which we add to the area of the pink triangle in diagram 5 for a total area above the 'don't care' line of 252 sq. mi. As a fraction of the total area, that is 252 / 314 = 0.8025 = 80% of the total area. Done. Q.E.D.
Proof of Diagram 4
I am assuming knowledge of HS geometry. I can't teach that in a blog post so find someone to help you if you forgot your geometry.
In diagram 7 we want to find the area of the green section of the circle labeled "G". We do that by finding the area of the pink section, labeled "P", and adding in the two equal white sections "W1". We will then subtract that total area ("P" + "W1" + "W1") from the area of the whole circle giving us the area of the green section "G".
From the "proof of diagram 3" in the preceding section we know that "P" subtends an arc of 120 deg. = 1/3 of the circle. A circle of radius 10 miles has area = "pi R squared" = (3.14) (10 x 10) = 314.2 sq. mi. Therefore 1/3 of that is 104.7 sq. mi. Now all we need is the area of the two white "W1" sections to add to the area of "P".
Area of "P" = 104.7 sq. mi.
 |
| Diagram 7 |
Look at diagram 8 below and note that the pink section P in "Diagram 7" above contains the two T1 triangles in "Diagram 8" below plus the two white sections W2 also seen in "Diagram 8".
The W2 sections are the same as the W1 sections we need to add to the area of the pink section of "Diagram 7".
We found the area of one pink T1 triangle in the previous "Proof of Diagram 3", above to be 43.4 sq. mi.
The two T1 triangles together thus have area 2 x 43.4 = 86.8 sq. mi.
If we subtract the area of the two T1s in "Diagram 8"from the area of the "P" in "Diagram 8" we have the areas of the two W2 sections.
So, Area of:
2 x W2 = P - 2 x T1= 104.7 sq. mi. - 86.8 sq. mi. = 17.9 sq. mi.
Recall that the area of W1 is the same as the area of W2
 | |
|
The area of the Green section "G" in diagrams 7 and 8 is then:
the area of the circle (314 sq. mi.) minus the area of (P + 2 x W1)
= 314 - (104.7 + 17.9) = 191.4 sq. mi.
This is 191.4 / 314 = 0.61 = 61% of the area of the circle is outside the radius of commuting.
= 314 - (104.7 + 17.9) = 191.4 sq. mi.
This is 191.4 / 314 = 0.61 = 61% of the area of the circle is outside the radius of commuting.
Done.
Q.E.D.
End of Proofs and of post.
Q.E.D.
End of Proofs and of post.