Analysis of KQED on CASA
Part I: Rachael Myrow
This is an analysis of radio station KQED Forum's conversation on CASA on February 2019. CASA is MTC's broad collection of suggestions for housing in the 9-county San Francisco Bay area. More here: https://mtc.ca.gov/our-work/plans-projects/casa-committee-house-bay-area
Host Rachael Myrow, talked with Susan Kirsch of Livable California, Michael Corruvabias of TMG Partners, (a housing development company), and Guy Marzorati reporter for KQED.
Link to this post is: https://meetingthetwain.blogspot.com/2019/02/kqed-forum-on-casa-analysis-i.html
Part II is found here: https://meetingthetwain.blogspot.com/2019/02/kqed-forum-casa-analysis-ii.html
The transcript can be found here:
https://meetingthetwain.blogspot.com/2019/02/kqed-forum-casa-susan-kirsch-of.html
Introduction
Initially, Rachael Myrow describes the situation in general. She covers the conventional wisdom "talking points" leading to issues.
Rachael Myrow: "Construction cranes everywhere..."
This is a version of '...the Bay Area's tremendous growth'. But look at census data and you'll say "what growth?" There's been some, sure, but as always the question is "compared to what?" As seen in the chart below, of the US's 50 most populous census metro areas (US Census bureau definition) San Jose and San Francisco metro area's growth is below average (click chart to enlarge).
Metro Area Growth
18 years of Growth by Percentage
 |
| US Census Data 2000, 2010 and Census ACS 2017 Census definted "Metropolitan Statistical Area" - MSA |
Not only are the Bay Area metro areas not growing much in percentage terms - they aren't growing much in sheer numbers either. In fact a number of metro areas grew more than the combined growth of San Francisco and San Jose metro areas - see graph below (click on image to enlarge):
Metro Area Growth
18 years of Growth by Population Numbers
 | |
|
More on population growth here:https://meetingthetwain.blogspot.com/2018/10/on-move-1.html
Implied in all this "tremendous growth" idea is that high population growth leads to high housing costs. Is that true? Actually, no. There seems to be no correlation between high growth and house prices. See graph below.
Implied in all this "tremendous growth" idea is that high population growth leads to high housing costs. Is that true? Actually, no. There seems to be no correlation between high growth and house prices. See graph below.

Rachael Myrow: "LA style traffic everywhere."
This is really the issue - not housing. There is (relative to income) lots of affordable housing and lots of high paying jobs. The big frustration is getting from the affordable housing to the good jobs.
In the US people arrange their lives so that on average their commute is about 30 minutes - varying widely from day to day within an urban area. Averages hide a lot. They are lowered by the large number of people that work off-hours. E.g., the night shift at a hospital doesn't experience congestion going to work.
We see below what an average really means. It means people experience difficult commutes - some days and times it is worse than others. It is the "worse" that makes people start looking for a job in another state.
Distribution of Morning Commute Times
SF vs NYC

https://meetingthetwain.blogspot.com/2018/07/commute-times.html
 |
| LA Freeways - 8 to 10 lanes in each direction "You can't build your way out of it". |
More and wider freeways would help one aspect of congestion but there is nothing that can be done about congestion on local streets. These have become rush-hour nightmares because they are the few streets that connect freeways with residential areas.
These are not only "last mile" connections but also "overflow lanes" because the freeways are too clogged. GPS directions plotting the "shortest time" routes between cities often avoid freeways entirely and direct traffic through all the little side streets. No one likes this - not the drivers and definitely not the residents of what used to be quiet residential neighborhoods.
These are not only "last mile" connections but also "overflow lanes" because the freeways are too clogged. GPS directions plotting the "shortest time" routes between cities often avoid freeways entirely and direct traffic through all the little side streets. No one likes this - not the drivers and definitely not the residents of what used to be quiet residential neighborhoods.
 |
| Sign in Fremont CA telling drivers "Don't Trust Your Apps" because of "No Left Turn" during evening commute hours |
Hollenbeck in Sunnyvale, or Grant Road in Mountain View, or so many others that were designed as quiet little streets to connect neighborhoods - they can not be widened. They are the bottleneck to increased density.
The head of the Sunnyvale Public Safety union is on record as saying that there is already a serious problem getting emergency vehicles through traffic during certain times:
The head of the Sunnyvale Public Safety union is on record as saying that there is already a serious problem getting emergency vehicles through traffic during certain times:
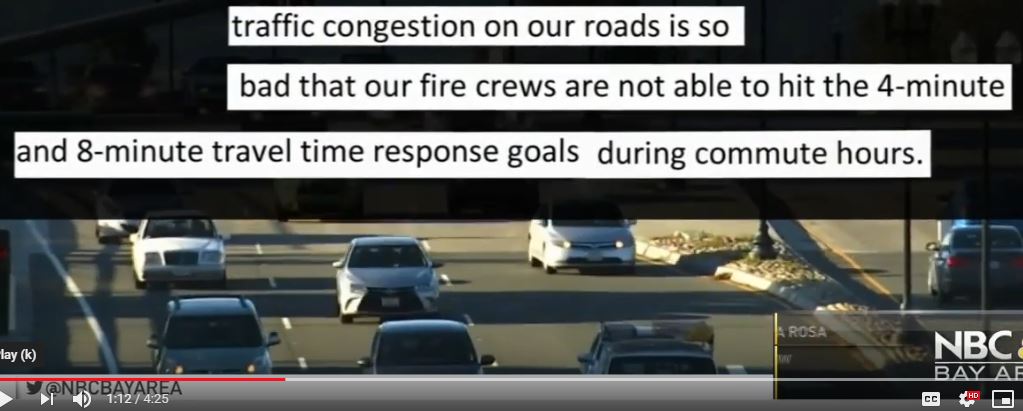 |
| "Traffic congestion on our roads is so bad that our fire crews are not able to hit the 4-minute and 8-minute travel time response goals during commute hours." At the 1:08 mark on: https://www.youtube.com/watch?v=PgSOSguJcMU&feature=youtu.be |
On the city council that is all I hear about from residents - traffic on El Camino and local streets. It can take as much as 30 minutes of stop-and-go (mostly stop) - watching traffic lights cycle through red and green repeatedly - to travel the last 2 miles home once you leave the freeway. That this might happen only one or two days day a week doesn't diminish the effect on people's perception of the quality of their life.
One obvious solution would be for companies to expand closer to housing. Why is that never mentioned?
Rachael Myrow: "Millions struggling to pay the rent, let alone buy a home in the San Francisco Bay Area."
 High housing costs, not traffic, is the issue at hand. Partly, these costs are high because not just the SF Bay Area, but the entire US is in the middle of a housing bubble. Housing price increases throughout the US have far exceeded increases in income as the next graph (from the Federal Reserve) shows.
One obvious solution would be for companies to expand closer to housing. Why is that never mentioned?
Rachael Myrow: "Millions struggling to pay the rent, let alone buy a home in the San Francisco Bay Area."

Housing Prices RISE and FALL
Incomes mostly go up but not in synch with housing
Click on image to enlarge

Incomes (red line) have risen steadily but...
Housing prices (blue line) have risen much faster. A bubble like 2008.
Housing prices (blue line) have risen much faster. A bubble like 2008.
Ultimately this is not sustainable. Prices cannot long exceed the average person's ability to pay them. It takes a while but people will move to where they can afford housing - whether it is Contra Costa County or Charlotte, NC. When the bubble bursts is anyone's guess but it appears there was some softening in real estate starting in late 2018. More here: https://wolfstreet.com/2019/02/21/the-us-housing-market-begins-to-feel-the-pain/
Not just a housing bubble but a stock market bubble as well. Several valuation methods put 2019 as more excessive than 1929 and almost as irrational as the 2000 "dot-com" bubble. See graph below:
How Overvalued is the US Stock Market ?
(click image to enlarge)

As of May, 2020
A lot of companies are using this stock bubble by giving out stock options in lieu of cash. People are using those increasingly valuable options to buy housing - squeezing out those that can't compete. When those options become worthless in a large market correction a lot of the money available to bid up prices will disappear.
But the SF Bay area is actually not the worst area in terms of housing "affordability". The prices are much higher here than in other cities in the US but so are salaries. When we correct for that we see several major metro areas where housing takes more out of a paycheck. See graph below (click on image to enlarge):
 |
| From: https://howmuch.net/articles/hours-work-afford-home |
The most un-affordable place is NYC, followed closely by Los Angeles. The housing costs are higher in the San Francisco Bay but so are the salaries. The following graph from data on the same HowMuch.net site of the above visualization shows the top cities in hours to work to pay the mortgage:

Rachael Myrow: "It's a crisis, no doubt..."
The way this word "crisis" is used in "housing crisis" is odd. "Crisis' means the same in English that it does in the original Greek - "turning point". We use it that way most of the time with "if... then..." phrases. "The disease is at a crisis point. If the fever doesn't break then we must operate." "Negotiations are at the crsis, If they fail then there will be a strike." In regard to housing, "if...what(?) then...what(?)"??
Perhaps it is "if we don't build a lot then housing will be unaffordable?" (Just a guess). If that is the "crisis" then let's look at affordability.
"Housing affordability" in California has been varying in a range for decades. Affordability has been both better and worse in California over the last 34 years as seen in the following graph. At the moment affordability is towards the lower bound. It was worse in the early 1990's and in 2002-2008. See following graph (click image to enlarge):\
Housing Affordability
Variation Over Time
 |
CA housing "affordability" has been mimicking national affordability.
|
Looked at by County we see that over the last 27 years back to 1991 affordability has not been very high in any of LA, SF, or Santa Clara County (Silicon Valley). We are currently at neither the lowest nor the highest levels of affordability.
Housing Affordability
Varies over Time
 |
| Data from California Association of Realtors https://www.car.org/marketdata/data/haitraditional |
A bigger question...
...if we can't say what makes this a "crisis", how will we know when it isn't a "crisis"? Is affordability the benchmark? If so, then does the fact it is well within a range going back to 1984 mean California has been in a crisis for 34 years? If affordability is the benchmark, then has Fifth Ave. in NYC been in a "crisis" for over a hundred years? Has the Champs Elysee' in Paris been in a "crisis" since Napoleon?
Rachael Myrow: "But if there's widespread agreement about the causes of the crisis, hello, Silicon Valley..."
Well here we are again. What is the crisis? What is this "widespread agreement" that Ms. Myrow is postulating? And why highlight Silicon Valley when San Francisco has added more jobs overall than any other county and, as we saw in the above chart, is far less affordable than Santa Clara County (containing most of Silicon Valley)?
 |
| 517,000 Jobs added 2002 to 2018 Of all counties, San Francisco added 32% The most jobs by far. c.f., https://meetingthetwain.blogspot.com/2018/03/sf-bay-area-1-live-work-commute.html |
I seem to have contradicted every word she said. This is not a reflection on her but on the "conventional wisdom" which she articulates so well. While certainly "conventional" it is not very "wise" when compared to, you know, actual data.
I do think Ms. Myrow was trying to be fair. In later parts of the Forum, she asked reporter Guy Marzaroti if market forces wouldn't do the job as well as CASA. She also asked Mr. Marzaroti if there were not some legitimate concerns of residents about traffic, etc. as opposed to the NIMBY-YIMBY narrative that Mr. Marzaroti was advancing.
Conclusion of Part I - Rachael Myrow
This concludes our analysis of Rachael Myrow's introductory comments.
Like most journalists, Ms. Myrow covers a wide range of topics in a year and cannot reasonably be expected to be expert in all of them. The phrase "a mile wide and an inch deep" comes to mind for most journalists. I am not faulting Ms. Myrow for her statements.
For Part II, go to:
For this part of the analysis we are at...
