Search This Blog

Tuesday, June 18, 2019

McKinsey: SF Density & Cathedrals

Forensic Analysis of McKinsey Report
Part 2

Introduction:

This part of the analysis looks at the McKinsey Global Institute (MGI) report on "infill" housing that could be constructed in San Francisco and Los Angeles. We note a large number of glaring errors that anyone with even a casual knowledge of San Francisco could see are absurd.  In-fill housing to replace Grace Cathedral, St. Mary's Cathedral, and the Consulate of the People's Republic of China (among many others)??!
Grace Cathedral - McKinsey says it is underutilized housing

Link to this blog post for sharing:
https://meetingthetwain.blogspot.com/2019/06/mckinsey-sf-density-cathedrals.html

The previous post on McKinsey's report is here:
https://meetingthetwain.blogspot.com/2019/06/mckinsey-housing-gap-part-1-a.html


Summary:

McKinsey purports to have found space for 590,000 to 990,000 (average = 780,000) potential housing units in San Francisco by simply building-up the density of existing residential property spaces to their maximum capacity.  McKinsey pays particular attention to those severely underutilized marked in red (<25% utilization) and yellow (<50% utilization).  See map below:

Map is from report page 19, exhibit 13.
However, many of the spaces they marked as very under-built (i.e., less than 25% of zoned capacity) are actually landmark churches such as St Mary's Cathedral, Grace Cathedral, a hospital center, numerous historic landmark churches and various religious schools.  These represent the majority of severely under-utilized spaces yet are clearly not available.  Their estimate of 780,000 potential housing units in San Francisco is therefore invalid.

Some of the large spaces marked in red as "under-utilized housing" are such well known San Francisco landmarks that it is hard to believe that anyone (including the McKinsey authors) actually looked at the map McKinsey features so prominently.  See map below:

Annotated map,  More detail below.
There may or may not be opportunities for increasing density in San Francisco without changing zoning but McKinsey's "analysis" is so deeply and obviously flawed it is essentially "fake data".


The McKinsey report is available here:
https://www.mckinsey.com/~/media/McKinsey/Featured%20Insights/Urbanization/Closing%20Californias%20housing%20gap/Closing-Californias-housing-gap-Full-report.ashx


Detailed Discussion:

Their key points are summarized on page 6 of the report.  Looking at McKinsey's item 2:

"Item 2.  Increase Density of Urban Areas"

MGI recommends increasing the housing supply by various means including building "nearly one million units on land zoned for multifamily development but underutilized" (page 6, upper right column).

On page 26, the MGI authors write:

"To determine the size of the opportunity, we mapped every land parcel in two counties: San Francisco and Los Angeles. We examined existing density on every residential parcel and identified parcels zoned for multifamily use that contain multifamily buildings that are not fully utilizing zoned capacity."

Whew!  Sounds like a lot of work examining "existing density on every residential parcel...that contain multifamily buildings that are not fully utilizing zoned capacity.".  

Here is the map of San Francisco they came up with to show underutilized parcels.  I added some numbered rectangles for reference to look at some of the blocks "that contain multifamily buildings that are not fully utilizing zoned capacity."  The legend in the corner shows that dark red means less than 25% of the zoned capacity is used.  We need to remedy this!  Let's see who these culprits are!  

We check out some of the under-utilized lots in the numbered rectangles below.  Map is from report page 19, exhibit 13.


For those of you on the go, here is the short version.  The same map as above but with some (not all - there were too many to fit) of the more historic and "unlikely to be housing" places McKinsey marked as "underutilized" for housing.  Click on image to enlarge.


I had to leave off the map some of the historic landmark churches and other buildings in the above map but they are included in the full investigation below.  These are some fascinating stories that anyone who loves San Francisco (as I do) would find it worthwhile to learn about.  You may live there (as I did for 5 years) and walked right by these gems without realizing their history.  All the history that McKinsey Global Institute (MGI) urges be torn down and made into high rise apartments.

But the point remains.  Their entire story of underutilized housing has no credibility at all since they clearly did not look at the properties they designated as "under-utilized" - unless they are seriously recommending tearing down Grace Cathedral and many, many more landmark churches and schools for housing.


Block 1 - Purple: Holy Trinity Cathedral, St. Brigid's School


As you can see, at location A at the top is the clearly marked "Holy Trinity Cathedral" and at location B at the very bottom is "St. Brigid School" with a church right next to it.  These are marked by MGI in bright red as two of the "nearly one million units on land zoned for multifamily development but underutilized".  Just three small parcels but perhaps MGI was being a tad careless in checking their map for underutilized land?

Box 1, Location A:  Holy Trinity Cathedral - Built 1909

The oldest Orthodox parish in the lower 48.
Built 1909 after the 1906 Earthquake destroyed earlier one.
The oldest Orthodox parish in the lower 48.  Holy Trinity Cathedral Parish traces its history to December 2, 1857.  Bright red on MGI's map.

The bells in the cathedral were made in 1888 in Moscow.  "And I love the bells calling people to the church.  The ringing is not sing-songy as is common in America." Review at: 

Box 1, Location B:  Saint Brigid Church - Built 1902

Saint Brigid Church - Built 1902
California Landmark
https://noehill.com/sf/landmarks/sf252.asp
Saint Brigid Church on 2151 Van Ness Avenue at Broadway.  And right behind it on Broadway is St. Brigid's school.  Both are marked on the map in red by McKinsey Global Institute as less than 25% of potential housing capacity.

St. Brigid's School.  125 years of education.
McKinley Global Institute lists it as severely "underutilized" for housing.

Block 2 - Light Blue: Grace Cathedral, Numerous Hotels, &c.

Continuing on looking at some of the "nearly one million units on land zoned for multifamily development but underutilized"  Several very large red blocs all together certainly stand out in block 2 in the right of the map.  Out of curiosity I looked more closely.  Fortunately, key streets like California and Van Ness are clearly marked on MGI's map so it is easy to locate on a Google map where the corresponding red blocks indicating "<25% utilization" are on MGI's map.

It turns out none of the areas marked in red are "underutilized for housing".  MGI gets a zero for this one.  Click image to enlarge.


For those unfamiliar with San Francisco's landmarks in this area, I have assembled the following information on these "underutilized housing units".

Grace Episcopal Cathedral
(Upper Left Corner of Boxed Area)
Cornerstone laid in 1910
Included on MGI's map of areas of San Francisco underutilized for housing.
Historic Landmark and fully functioning Episcopal cathedral - including a school.  Wikipedia entry:  

For good measure, MGI has also included as underutilized "multi-family housing" the large Masonic Lodge on the other side of California street in the lower left corner.  I have omitted a picture.  It isn't that interesting.  It also isn't housing.

James C. Flood Mansion - 1886
Pacific Union Club


Historic Landmark - currently occupied by the Pacific Union Club.  It is the only one of the Nob Hill Mansions to survive the fires following the 1906 earthquake.  The other mansions were made of wood painted to look like stone but the Flood Mansion was made of real stone imported from Vermont.  Wikipedia entry: 

Landmark Hotels
Fairmont, Mark Hopkins, Huntington, Stanford Court, 
All have Historical Landmark Status
None of them are currently "underutilized housing".

Fairmont Hotel - built 1906
https://en.wikipedia.org/wiki/Fairmont_San_Francisco

Mark Hopkins Hotel - built in 1926
https://en.wikipedia.org/wiki/Mark_Hopkins_Hotel

Stanford Court Hotel - 1911
Originally Luxury Apartments

https://en.wikipedia.org/wiki/Stanford_Court_Hotel
Huntington Hotel - 1922
Originally Apartments - converted to hotel in 1924

https://en.wikipedia.org/wiki/Huntington_Hotel_(San_Francisco)
None of the areas marked in bright red as "underutilized" for housing are underutilized housing areas.  Not one.  One might give McKinsey a pass on the earlier churches and school since they were small parcels, but not noticing some of the most famous hotels in the country, not to mention the highly visible Grace Cathedral, has to bring into question the validity of their research on this.  Even if they were made housing this is one of the priciest areas in San Francisco - any housing there is going to be very, very expensive.  Let us go on.  It gets worse.


Block 3 - Purple: St. Mary's Cathedral, Historic Churches, Chinese Consulate, Schools

St. Mary's Cathedral in the center.
Click map above to enlarge for readability
Anyone who has lived in San Francisco has to know Geary Blvd.  And one of the most notable landmarks on Geary is St. Mary's Roman Catholic Cathedral.  This is also marked in bright red by MGI (center upper right of box) as one of  "nearly one million units on land zoned for multifamily development but underutilized"  Click image to enlarge.

Cathedral of Saint Mary of the Assumption
Commonly called St. Mary's Cathedral
MGI marks it as underutilized housing.
(click image to enlarge)
The cornerstone was laid in 1967.  In 2017, Architecture Digest named it one of the 10 most beautiful churches in the United States.  It is not hard to miss - it is impossible to miss!  

It seems MGI didn't even look at their own map.

St. Mary's interior
St. Mary's is one of the "multifamily buildings that are not fully utilizing zoned capacity."  I guess MGI figures a nice 25 story apartment building should go there.  "Really Bishop, it will be very nice, all glass and steel, you can use the basement for bingo night, lots of underground parking."

Also in the map above are some much smaller historical landmark churches still in active use (marked by McKinsey in red, of course).  In the upper right corner of box 3 in the aerial view is: 

First Unitarian Church - built 1889
"Apartments go here!" according to MGI
Church Website: http://www.uusf.org
Located at 1187 Franklin Street at Geary on Cathedral Hill, built 1889 (survived 1906 earthquake), it is still in active use.  It is "Historic San Francisco Landmark" #40 

Right next to it (in red) is a Montessori School - https://www.yelp.com/biz/montessori-house-of-children-san-francisco
MGI marks this as severely "underutilized" housing.
McKinsey Global Institute doesn't like playtime.  

MGI goes in the corner until they learn to play well with others.
In the same red area is the Sarcophagus of Thomas Starr King honoring a Unitarian minister from the Civil War era.  He helped put California on the Union side in the American Civil War and worked to form a precursor to the US Red Cross.  Rev. King has a mountain named after him in Yosemite, another in New Hampshire, and a statue in Golden Gate Park.  The phrase "A man to match our mountains" refers to him.  The sarcophagus is Historical Landmark #691. 

Just below the First Unitarian Church in the far right of box 3 is St. Mark's Lutheran Church, also marked in red.  Dedicated in 1895, it survived the 1906 earthquake and fires and is in active use.  
https://www.stmarks-sf.org/
St. Mark's Lutheran Church - 1895
San Francisco Historic Landmark #41
Some of McKinsey's "underutilized housing"
https://noehill.com/sf/landmarks/sf041.asp

St. Mark's interior.  Photo from:
http://jasonwphotos.blogspot.com/2011/04/jay-and-melanie-st-marks-church-san.html
Looking down the aerial photograph you see part of Sacred Heart Cathedral Preparatory high school associated with St. Mary's Cathedral.  It was founded in 1852 though obviously the building is newer.  This was also marked by MGI in bright red as underutilized housing.
Exterior View of Sacred Heart Cathedral Prep.
School website: https://www.shcp.edu/  Wikipedia entry:

Also in box 3 just to the left of St. Mary's Cathedral (marked in red as severely "underutilized" housing) is the "Consulate of the People's Republic of China".  It is clearly identified on any map of San Francisco.  The building itself is of no particular importance (as far as I know) except as an indicator of the quality of MGI's attempt to identify "underutilized" housing.

Box 3 was a "target-rich environment" in terms of finding McKinsey's mistakes so I need to repeat the map to point out even more "red block" errors.  This time I have put in letter keys to point out the buildings.

A:  Most of red block to the right of "A" in the lower right is Chinese American International School (CAIS) Middle School.  More here: https://www.cais.org/curriculum/middle-school.  The rightmost corner of the red block is a gas station - not "underutilized housing".  The little red rectangle to left above "A" is a soccer field - also not underutilized housing.

B: Little red block surrounded by orange is the Buchanan YMCA 

C: Central Gardens Convalescent Center and Phoebe Hearst Preschool in red rectangle to left of "C"

D: Glad Tidings Church https://www.gtsf.org/ to the north and FGSF English Ministry (a church) to the south of "D" http://fgsfem.org/

For box 3 (area around Geary Blvd.) of all the red boxes McKinsey claimed indicated underutilized housing - not one was right.  Not. A. Single. One.


Block 4 - Green: Two Landmark Churches and a Jewish HS

Letters A and B on the map refer to the: Macang Monastery and Art Museum, former St. Patrick's Church and Holy Cross Church.  It seems MGI listed the museum as only mildly underutilized housing (yellow) while the Monastery itself is highly underutilized (bright red).

Former St. Patrick's (1854) in foreground
Former Holy Cross Church (1899) in back
1822 Eddy St, San Francisco, CA
The little white frame building in the foreground in the picture above is the old St. Patrick's church.  It was moved from downtown many years ago.  It dates from 1854.  It is now the Macang Monastery's museum.  It is the oldest frame structure in San Francisco.  

The bigger stone building is the former Holy Cross Church finished in 1899.  Both buildings survived the 1906 San Francisco earthquake. They are "Historic San Francisco Landmarks".  Apparently McKinsey thinks they should be torn down and replaced with housing.  Either that or they are simply incompetent.


C: The big building on the right marked "C" in the map - where MGI put a big red box indicating severely underutilized housing - is (mostly) the Jewish Community High School. (There is a small parking garage on the right edge.)
McKinsey thinks this should be high density housing.

Block 5 - Black: Hospital, Library, & Jewish Synagogue


The large red box at the top of the box turns out to be "The California Pacific Medical Center" (CPMC - known locally as "Can't Park My Car") - a hospital.  It is a teaching hospital affiliated with Stanford, Dartmouth, and UC-San Francisco.
The California Pacific Medical Center
Who needs hospitals!  MGI says apartments could go there!
https://en.wikipedia.org/wiki/California_Pacific_Medical_Center
Continuing on in this strange world of "multifamily buildings that are not fully utilizing zoned capacity", AKA churches, schools, and hospitals I looked just a little to the south of the hospital at the smaller red blocks.  They are a Library and Synagogue - Historic Landmarks.

Health Sciences Library Building - 1912
https://noehill.com/sf/landmarks/sf115.asp
The library was "Designed by Albert Pissis and built in 1912, CPMC’s 20,000-square-foot Health Sciences Library Building at 2395 Sacramento Street was designated a San Francisco Historic Landmark 37 years ago."

And in the back of the picture above is Sherith Israel Synagogue, built in 1905, also designed by Albert Pissis.  It survived the 1906 and 1986 earthquakes, has been seismically retrofitted and is in active use.  The synagogue's Wikipedia entry states:

"Congregation Sherith Israel is one of the oldest synagogues in the United States. It was established during California's Gold Rush period and reflects the ambitions of early Jewish settlers to San Francisco. ...Its historic sanctuary building is one of San Francisco's most prominent architectural landmarks and attracts visitors from all over the world"  

Sherith Israel Synagogue - 1905
In active use.  "Attracts visitors from around the world"
The "McKinsey Global Institute" paints this bright red - i.e., much better utilized as apartments.


There are a few more churches on Van Ness Ave. (Highway 101) that McKinsey showed in bright red as being underutilized housing opportunities.

One was Old First Presbyterian Church at 1751 Sacramento St.  The parish was formed May 20, 1849 which makes it California's oldest protestant congregation.  They actively worked against slavery and to put California on the Union side against slavery during the Civil War.

Church dedicated in 1911.  Still an active parish church.
"Old First" is home to California's oldest active Protestant congregation.
http://oldfirst.org/index.html
Another is St. Luke's Episcopal Church at 1755 Clay Street.  The parish was founded in 1868.  As such it is one of the oldest Episcopal parishes in California.  http://stlukessf.org/

French Gothic sanctuary, built in 1910
Stained glass windows from 1911
1755 Clay Street (@ Van Ness)

There may be more San Francisco historic landmarks that "McKinsey Global Institute" has identified as "multifamily buildings that are not fully utilizing zoned capacity" (their words) but this isn't intended to be an exhaustive search.  All I did was scan a Google map for a few minutes to find these gems.  Anyone can do that.  McKinsey could have done that.  They obviously didn't check their map at all.  Neither did anyone else who goes around citing the McKinsey report


Los Angeles(?)

MGI also looked at Los Angeles County.  Their map of LA (below) is found on page 20 of their report:

The Los Angeles map is harder to read since LA is about 7 times larger in area than San Francisco. McKinsey did not include the La Brea Tar Pits as "multifamily buildings that are not fully utilizing zoned capacity" (I knew you'd wonder so I checked).  I decided not to go through their LA map.  What's the point?  We saw McKinley Global Institute's level of competency with regards to mapping housing opportunity in their San Francisco map.


Conclusion:  No one can doubt it is possible to increase the density of San Francisco and Los Angeles.  You can make any city look like Hong Kong or Lower Manhattan or any of a number of densely packed cities.

Chong Qing, China
Dense enough for you?
The purpose of the McKinsey mapping effort cannot be to indicate more housing could be built.  That is obvious to anyone.  Rather it supports the narrative that more housing can be built within the current zoning regimens of those cities.  This argues that housing would be more plentiful (and by implication cheaper) without any change in the appearance or loss of local control if cities would simply "allow" more housing to be built.

Looking at these historic landmarks - houses of worship, library, hospital, schools - one has to wonder why people couldn't just look at a Google or MapQuest map and see these things.  Not just the "McKinsey Global Institute" report writers but the many people that supposedly read the report and drew conclusions based on it.  This says something about the report but also about the people that supposedly read the report.

For now this is

of this part.  To be continued.

Friday, May 3, 2019

Irvine Co. Housing Development in Sunnyvale

New Housing Development in Sunnyvale

Former AMD Headquarters acquired by Irvine Corporation
(click image to enlarge)
The Irvine Co. is planning to build a large (for Sunnyvale) 1,051 unit housing development on the 35 acre site of the former AMD headquarters.  That required a change of zoning from industrial to residential (ITR).

Link to this page for sharing: https://meetingthetwain.blogspot.com/2019/05/irvine-co-housing-development-in.html

Future AMD site as planned by the Irvine Corporation
It is a mildly controversial project and while I agree with many of those who wanted changes I voted for it anyway.  This is to explain why.

The issue came before the Sunnyvale City Council on Tuesday, April 23, 2019 as item number 4 on the agenda.  The agenda with links to documentation is here:
https://sunnyvaleca.legistar.com/MeetingDetail.aspx?ID=672114&GUID=8EB397C3-1701-43B5-BE89-092C311A4D85&Options=&Search=

Item #4 is here:
https://sunnyvaleca.legistar.com/LegislationDetail.aspx?ID=3923629&GUID=80394B41-269A-4665-BCAC-3928786C300A&Options=&Search=

The visual depictions of what is planned are from Attachment 27 "Presentation to Council" on that above link.  Other pictures as shown in associated links.
Stewart Drive Now

Future Stewart Drive with 5-story apartments
Existing trees along Stewart Dr. will be kept
Several Redwood trees will be moved (they can do that!)
The project is to "construct 1,051 residential units, including 944 units in three to five-story apartment buildings and 107 units in three-story town-home style buildings. The unit count includes 45 apartment units for very low-income households and 13 below market rate town-home units. Public improvements include the dedication of a 6.5-acre public park, extension of Indian Wells Avenue to the east to connect with the Duane Avenue/Stewart Drive" (from introduction on Item 4).

3 story Town-homes facing new 6.5 acre park
I first heard about this project about 2 years ago (2017).  Then City Manager Deanna Santana and Trudy Ryan (head of the planning dept.) wanted to inform the council members of the project and some of the concerns they had.

Projected low rise 3-story apartments on Stewart Ave.
One of the concerns was simply the appearance.  It was flat and imposing.  I had seen a building just like it in Santa Clara and really did not want that to be in Sunnyvale for the next 50 years or more.

Indian Wells Ave. (lower left) goes nowhere - it is an access road to residential buildings.
It will be extended to E. Duane Ave. on the upper right in the picture.
This should help traffic flow to Lawrence Expressway.
I gather that the Irvine Corp. made a mistake and paid too much for the AMD land not realizing Sunnyvale's park dedication requirement was higher than that of some neighboring cities.  In order to make it work with the higher than planned cost for parks they needed to put in more units than they had originally planned and were doing everything they could to make it fit.

If they couldn't make it "pencil out" financially as a residential development they would just leave it as a commercial office development - perhaps something like the picture below:
A development in Houston.  This can happen here!
https://blog.chron.com/primeproperty/2014/09/citycentre-embarks-on-major-expansion/
If you think the project shown above would not happen here, think again.  Santa Clara had a proposal for a 50-story office building with a 35-story apartment building and several other smaller ones.  The height has since been scaled down in Santa Clara but the amount of office space is the same.  They traded away open space (park land) to lower the height.  C.f. http://meetingthetwain.blogspot.com/2018/06/50-story-office-building-in-santa-clara.html.

50-Story building in Brooklyn
Might have been one in Santa Clara
Office rents in Sunnyvale have exploded recently as has the cost of land ($10M/acre last year but it might be higher now) and with it the necessity for more height and density to pay for the land.

If the AMD site stayed commercial, we would not get the residences nor the park nor would Indian Wells Ave. provide an alternative route to Lawrence Expressway.  We would get much more traffic because the office buildings would be higher and more densely packed than the existing AMD building.
Drawn in 1900 - not too far from reality.
https://ephemeralnewyork.wordpress.com/2011/12/29/new-york-city-as-it-will-be-in-1999/
In order to make it work and still be attractive, Sunnyvale planning staff worked a lot with the Irvine Co. to find variances that could make it financially viable and still be an attractive addition to Sunnyvale.  I think they did a very good job, all things considered.

The Irvine Co. has another apt. complex (Cherry Orchard Apartments) in Sunnyvale at 250 W El Camino Real, Sunnyvale, CA 94087 (Mathilda and El Camino - behind "Trader Joe's") which isn't too far off from what they are planning for the AMD site.

Click image to enlarge
https://www.irvinecompanyapartments.com/locations/northern-california/sunnyvale/cherry-orchard.html
In addition they are hiring local union labor at good wages instead of trying to cut corners with non-union labor bused in from Southern California or Arizona.

There will be some BMR (Below Market Rate) housing for "Very Low Income" (VLI) households.  Almost no one builds for VLI households.  BMR housing is subsidized by rents from the market rate apartments.  Builders would much rather build BMR housing units for "moderate income" renters with incomes up to 120% of area median income.  That results in more BMR units but with less subsidy per unit.  Some builders are afraid that the VLI tenants cause problems.

Also in my mind at the time was the progress of California Senate Bill SB-50 (and others) through various committees.  There is currently a narrative that Silicon Valley cities like Sunnyvale don't mind allowing in new commercial buildings (and jobs) but balk at allowing new housing thus forcing housing further and further out causing more traffic.  I do not wish to feed that narrative.
More on SB-50 here: https://meetingthetwain.blogspot.com/2019/04/forum-on-sb-50.html

Regardless of whether that is an accurate narrative, the bills that could become laws basically allow builders pretty much free rein in an attempt to foster as much residential building as possible.  I would much rather have the housing we will get with the Irvine Co. project than what SB-50 would force upon us.
207 Boylston, Seattle.  Coming soon to a lot near you if SB-50 passes.
We will get worse traffic no matter what so we'd better learn to deal with it.  If you are a homeowner the increased density will make your home worth more so you can sell out for even more and leave for a less crazy place - if there are any.  This "build more to make it cheaper" nonsense is everywhere - I always ask why, then, are Hong Kong and Lower Manhattan the most expensive areas in the world.  I never get a real answer.

The Irvine proposal is the best we can ask for.  I do not regret voting for it.

Monday, April 22, 2019

SB-50 Suggested Amendments

SB-50 Suggested Amendments

On April 22, 2019 I sent the following letter to all members of the California Senate Governance and Finance Committee.  They will consider SB-50 on April 24th - 26th, 2019.  A full list of the Committee Senators and their emails is at the bottom of this post:
A more readable formatted version of SB-50 is available for download here: 
https://drive.google.com/open?id=1yPfqWvSvnVhbYhFnQVUJVXcpdgiG1vgu

----------------------- begin letter ---------------------

Dear Senator,

Thank you for your service to the people of California.  

While I oppose SB-50 as a “one-size-fits all blunt instrument” here are some suggestions a number of us feel would make SB-50 much more likely to accomplish its stated goals.

1.       Avoid Displacement:  There is high likelihood that builders could use SB-50 to “gentrify” lower income neighborhoods increasing displacement and homelessness. 

a.     Not Apply to Low Income Areas:  To avoid gentrification, the provisions should not apply to jurisdictions where the average income is below the state median.

b.     Require BMR in All Buildings:  The current SB-50 exemption of 10 units or less from any BMR requirement is less stringent than that of Sunnyvale and other communities.  It should be strengthened to at least 15% in all units constructed under SB-50 incentives.

c.       Database of Renters: SB-50 excludes places that have been rented in the previous 7 years.  Without a database of renters cities have no way of enforcing this.  An Assembly bill currently being considered would create a state-wide database of renters.  SB-50 should explicitly state it will not take effect unless and until such a renter’s database is created for any jurisdiction subject to SB-50.

2.       Define “Jobs-Rich” and “Good Schools”:  SB-50 does not clearly define “jobs-rich” and “good schools” even though those are key criteria for imposition of SB-50 mandates.

a.        “Jobs Rich” Definition: A well-defined objective quantitative rule should be written into the law - such as jobs with average pay 50% above the county median – or some similar clear and identifiable criteria.

b.      “Good Schools” Definition: A well-defined objective quantitative rule to define good schools might be schools scoring in the top 50% of the state.

3.       Define “Housing Crisis”:  If SB-50 is meant to “solve” a “housing crisis” in California it should define what it is in clear objective quantifiable means so we know where and when it applies.  It is impossible to solve a problem if you can’t tell when you are done.

a.       Objective Standard Needed: An objective standard needs to be defined which will enable a jurisdiction to know when it is subject to SB-50 so it will know what it needs to do to satisfy that condition.

b.      Not apply to areas not in a “housing crisis” - Of California’s 58 counties only 17 have a population over 500,000 – 23 counties have fewer than 100,000 residents.  In the vast majority of those counties housing costs are at or below the national average.  Thirteen counties are actually losing population. There is no need to give density bonuses in those counties as it will not lower already low housing costs.

4.       Environment: There are eight mentions of the environment in SB-50 but nothing explicitly improving sustainability.  To further strengthen California’s environmental record:

a.       Protect Solar Panels: SB-50 should explicitly state that no building under SB-50 may block the sun from existing solar panels or roofs where solar panels could reasonably be positioned.   Without this, property owners will be afraid to install solar panels for fear they could be shadowed by a nearby building. 

b.      Require Solar Panels: The California Energy Commission and Senator Wiener’s San Francisco have made a huge impact by requiring solar panels on certain types of new buildings under certain conditions.  SB-50 should further those goals by requiring that all new construction under SB-50 be required to have solar panels covering the equivalent of at least 70% of all roof surface area.

c.       Net-zero Buildings: California has made great strides in reducing GHG emissions in power generation, but there is almost nothing being done to reduce GHG emissions from buildings.  SB-50 eligible construction should be “net-zero” GHG emitters.

d.      Eliminate Natural Gas:  Natural gas is the dominant contributor to GHG emissions from both residential and commercial buildings (for space heating and hot water heating).  Forbidding SB-50 eligible construction from having natural gas connections – using heat pumps instead (already popular in Europe) – would set an example for the entire US.  We in Sunnyvale are moving in that direction as are other communities around the world.

Thank you again for your service to the people of California.

Sincerely,
Michael S. Goldman
Sunnyvale City Council Member, Seat 7
I write solely on my own behalf.

Saturday, April 20, 2019

City Power Over Wireless Towers

Recent ruling by California Supreme Court says any city has "inherent local police power” under the California Constitution to determine the appropriate uses of land within its jurisdiction.  That includes cell phone towers so a city (like Sunnyvale) can tell a phone co. to adhere to city zoning standards for aesthetics.

More here:

http://www.cacities.org/Top/News/News-Articles/2019/April/California-Supreme-Court-Upholds-Local-Ordinance-R

The opinion is here:

https://www.courts.ca.gov/opinions/documents/S238001.PDF


Saturday, April 6, 2019

Forum on SB-50

California Housing
Challenging the Narrative

Summary:  The current narrative is that everyone wants to walk to work (especially millennials) and we should abandon Single Family Homes (SFHs) and build only high rise apartments.  Here we look at data relating to housing prices and commuting.  We see that about half the population prefers to own a single family house and commute and the other half prefers a denser environment (townhouse and condos) and walk, bus, or bike (not drive) to work.

Link to this post (for sharing):

Discussion and Slides:

These are the PowerPoint slides and text (with a few additions) Sunnyvale Council member Michael Goldman (me) used at a Forum on California Senate Bill 50 and related "housing" bills.  The forum was held on April 6th, 2019, in Cupertino.  Also presenting were city council members Lydia Kou of Palo Alto, Julie Testa of Pleasanton, and Mayor Steven Scharf of Cupertino along with Susan Kirsch of "Livable California".  A video of the event will be available soon, as will the slides used by all participants.

Slide 1 (click image to enlarge):

SB-50 applies to transit stops and "job-rich" areas with schools with "positive outcomes".  "Job-Rich" is defined as more jobs than surrounding area.  Does Merced have more jobs than surrounding farms and fields?  Sure.  Are there any schools that do not have "positive outcomes"?  No.  So SB-50 applies everywhere.

There is no time limit or other criterion for when we will no longer be in a "housing crisis".  Without any definition of the "housing crisis" we can't tell where or for how long it exists.  If you can't define the problem then you can't know when you've solved it.  So, SB-50 will apply everywhere and forever.  In other words the "housing crisis" will never end.  If it never ends, then SB-50 isn't going to solve the "housing crisis".  Maybe it isn't intended to.

The key thing to know about SB-50 is that it is not directly intended to increase housing “affordability”.  The idea is simply to increase the construction of apartment buildings by allowing them to be constructed in residential neighborhoods.

Under SB-50, any single family home can be torn down and replaced with an apartment up to 4 or 5 stories - with a “density bonus” that’s 5-6 stories.  Near transit stops it is 5-6 stories with density bonus going to 7-9 stories.  Only 1 parking space for every 2 apartments can be required by a city or county.  That means two 2-bedroom apartments (four bedrooms total) cannot be required by the city or county to have more than one off-street parking space to share among them.  The builder may decide to build more off-street parking for higher end apartments which might not rent without more parking.  However, no jurisdiction can require it.

Slide 2 (click image to enlarge):
https://embarcaderoinstitute.com/portfolio-items/sb-50/
Text of SB-50 here: 


This applies even to areas where housing costs are low and lots of housing is being built.  Areas like Riverside and Sacramento are already “affordable” to most people and there is lots of construction. Nonetheless, SB-50 applies there as well as San Francisco or Sunnyvale.

Slide 3 (click image to enlarge):
Minneapolis grew more than Silicon Valley?  Must be the weather!
From: https://meetingthetwain.blogspot.com/2018/10/on-move-1.html
and: https://meetingthetwain.blogspot.com/2019/03/lao-on-housing.html
The story is that there is a shortage of housing units because builders are unable to keep up with tremendous growth in the SF Bay Area.  This is false.  They can keep up with much higher growth in metro areas like Charlotte and Riverside where there is plenty of buildable land.

In fact, almost 90% of the top 300 US metro areas are affordable to any family with the median income.  It is only about 10% of those metro areas that are hard for median income buyers to afford.

Slide 4 (click image to enlarge):
https://shelterforce.org/2019/02/19/whose-affordable-housing-crisis
So why are housing prices high in the SF Bay area?  Simple - there's not much land to build on and some people can afford the high prices!  Revenue per employee is $1.3M at Google, $1.6M at Facebook, $1.9M at Apple.  Their employees don't get paid that much but they get paid enough more than the average worker that they are better able to outbid others for a single family home close to work.

You cannot bring in trillions of dollars from around the world and thousands of highly paid workers (with stock options) and expect costs to not increase.  What are people thinking?

Slide 5 (click image to enlarge):
From: https://howmuch.net/articles/tech-companies-revenue-per-employee
Shortages increase costs.  But high costs don’t mean there's a shortage.  A Lexus 500 costs 5 times a Corolla but there is no shortage.  Go buy 10 of them if you have the money.

Slide 6  (click image to enlarge):
The Great "Lexus Crisis" of 2019
So why are people commuting long distances instead of living near work?  Well, half the population wants to live in a small town.

Slide 7 (click image to enlarge):
https://uli.org/wp-content/uploads/ULI-Documents/America-in-2013-Final-Report.pdf
About the above graph - I want to point out this was from a survey done for both the "Urban Land Institute" (ULI) and "National Association of Realtors" (NAR).  The ULI desperately wants to stop suburban sprawl and get everyone to live in high rises.  They keep asking the same questions year after year hoping they will get answers they want to hear.  Instead they keep getting results (like slide 8 below) that say 50% prefer a Single Family Home, driving to work and stores, instead of condo/apt. and walk to work and stores.

Slide 8 (click image to enlarge):
Random variations in sampling means you never get the same proportions year to year.
https://www.nar.realtor/sites/default/files/documents/2017%20Analysis%20and%20slides.pdf
From: https://www.nar.realtor/reports/nar-2017-community-preference-survey
This applies to all generations - including "millennials".  Of millennials, 47% prefer "large yards & drive" vs. 53% who prefer "small yard and walk".  That is - with random variations in sampling - equivalent to a 50-50 split.

Slide 9 (click image to enlarge):
The "Greatest" generation are in their 70's and older and are less likely to want to drive.
From: https://www.nar.realtor/sites/default/files/documents/2017%20Analysis%20and%20slides.pdf
More at: https://www.nar.realtor/reports/nar-2017-community-preference-survey
So, lots of people commute from single family homes in distant suburbs to areas with lots of jobs but no room for more single family homes.  And VICE-VERSA!  People change jobs on average every 5 years - they aren’t going to change houses every time they change jobs!

And this shows up in actual data.  If we look at Palo Alto (slide 10) and how many commute more than 50 miles not only TO Palo Alto but FROM Palo Alto, we see that as population increases both the number and percentage of super-commuters increases – BOTH ways!  

Slide 10 (click image to enlarge):
Palo Alto increased both the number of jobs and the number of housing units from 2002 to 2015
resulting in more "super commuters" (Both Ways) than before.  (From Census data)
More here:  https://meetingthetwain.blogspot.com/2018/01/palo-alto-work-live-commute.html
This is absolutely normal.  This is how people organize themselves around metro areas in the US.

Slide 11 (click image to enlarge):
More here:
https://meetingthetwain.blogspot.com/2018/06/commute-distance-in-us-metro-areas.html
We have been building in the SF Bay area for years and are currently at the low end of affordability but it has been worse as well as better.  Slide 12 below shows that housing affordability in California has varied from a low of 14% in 2007 to a high of 55% in 2011.  It is currently at about 28% or roughly half way between the extremes.  Similarly for Santa Clara County, 27-year range of 12% to 42%, currently at 17%.

Slide 12 (click image to enlarge):

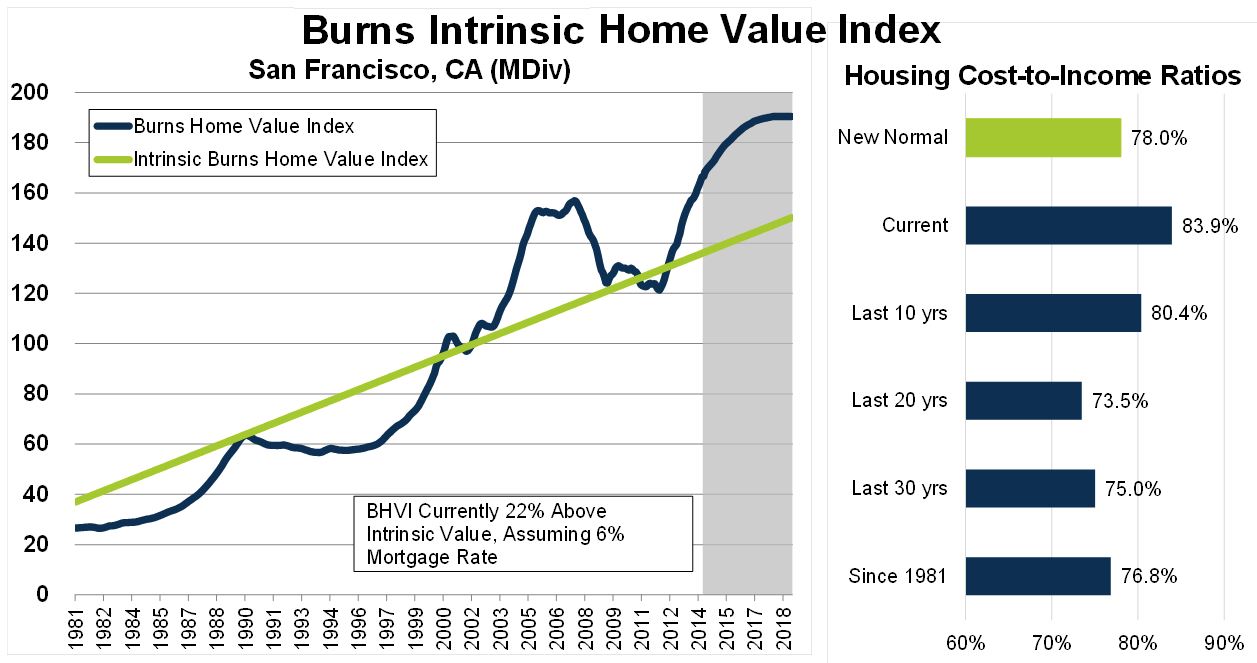
We are in the longest economic expansion in US history and it shows up in housing prices – if anything, it is a bubble not a crisis.

Slide 13 (click image to enlarge):
From John Burns Real Estate Consulting newsletter
This is projected to come back down to the trend-line by 2021 as seen in slide 14, below.

Slide 14 (click image to enlarge):
https://journal.firsttuesday.us/california-tiered-home-pricing-2/1592/
So what will happen?  "It is really hard to make predictions, especially about the future" (Yogi Berra) but two possibilities seem likely.

1.  Silicon Valley becomes like NYC with lots of tall buildings in the center and millions of commuters on mass transit (costing $Billions) - with suburbs sprawling out to Merced and Sacramento - or ...

2.  We become like LA.  We stop growing with new job centers forming in adjacent counties.  Many companies move to Texas or Washington state.  Silicon Valley population growth - already anemic at 6% below the national average - simply slows to a crawl.

Either way it gets more expensive.

Slide 15 (click image to enlarge):

For now this is....